Interviews with regulators
Transitions to a Solvency II world: Part 2
Part 1 of this extensive and first interview with Nathalie Berger, Head of the Insurance and Pensions Unit at the European Commission, looked at the impact...
Transitions to a Solvency II world: Part 1
Solvency II Wire about the Commission’s shifting priorities and the challenges of implementing and monitoring Solvency II. Nathalie Berger was appointed to head the Insurance...
Barnier on Omnibus II
Michel Barnier, European Commissioner for Internal Market and Services, responds to written questions from Gideon Benari, Editor of Solvency II Wire about the Omnibus II...
Transparency and legacy
The final part of an extensive interview Carlos Montalvo, Executive Director of EIOPA, in which he talks about the challenges of reporting, look-through and contemplates the future...
In depth analysis
Brexit and the covid-19 pandemic will likely have a lasting impact on the European insurance industry in 2021 and beyond....
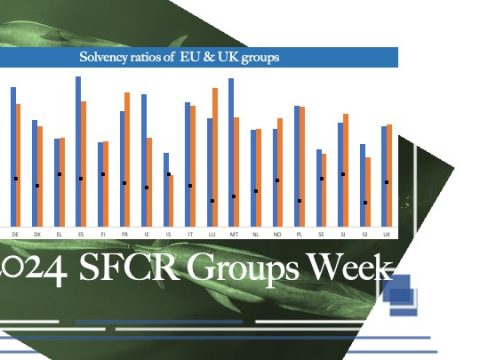
To date (1 May 2022) over fifty European insurance groups have published their 2021 group SFCR. The trend to publish...
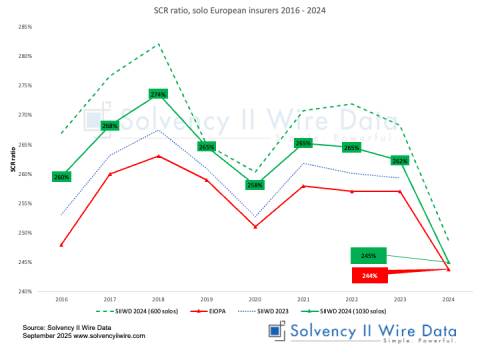
QRT data extracted from first 1,080 SFCR reports of European insurers for year end 31 December 2024 shows the solvency...
parrainé par [widget id="adsanity-single-2"] Cet article a préalablement été publié en anglais le 13/09/15. Toutes les citations directes doivent être...
[widget id="adsanity-single-2"] Cet article a préalablement été publié en anglais le 17/7/2014. Toutes les citations directes doivent être confrontées à...
Recent Posts
Japan Economic Solvency Ratio (ESR) – watch out for the drop
February 13, 2026
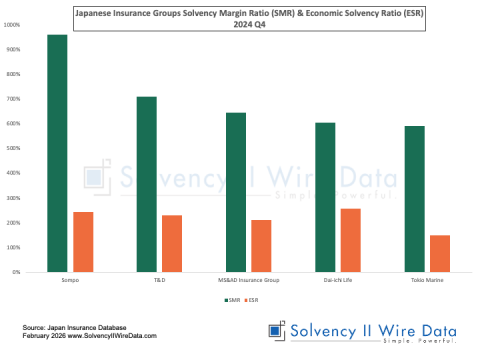
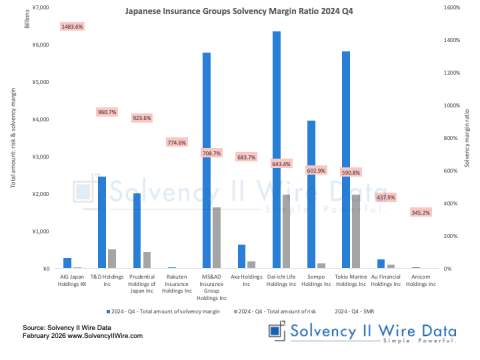
Japanese Insurance Groups – Solvency Margin Ratio 2024 Q4
February 8, 2026
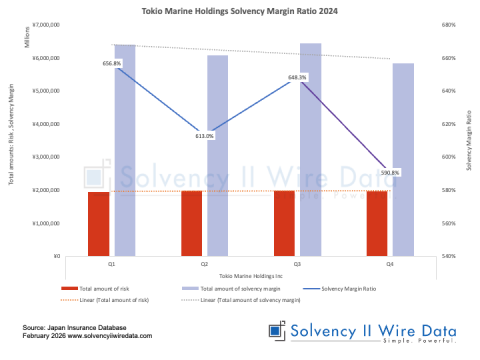
Tokio Marine Holdings Solvency Margin Ratio 2024
February 2, 2026
Japanese influence in Bermuda’s insurance landscape
December 31, 2025
Solvency II Wire Data – BLUE
December 21, 2025
Insurance private credit: a new 200-year-old idea
December 13, 2025
Tier capital (under)use by Bermuda’s insurance sector
November 27, 2025
Geopolitical risk impact on insurers
November 9, 2025
Webinar: UK Life Insurance Market Resilience – Trend or Anomaly?
November 4, 2025
Use of the risk margin in the Bermuda insurance market
November 2, 2025
Solvency II figures signal Premier Insurance failure
October 17, 2025
Exploring the state of the insurance market
September 7, 2025
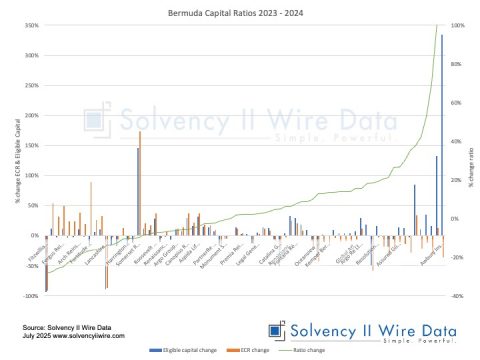
Bermuda Capital Ratios 2024
July 9, 2025
Czech Republic insurance market analysis
June 11, 2025
Solvency II group reporting annual statistics 2024
June 2, 2025

