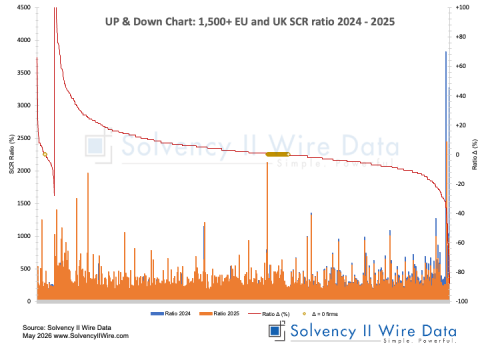
Analysis of the Solvency II ratios of 1,500 European insurance companies collected and processed by Solvency II Wire Data 30 days after the official publication date (7 April 2024) has identified 14 companies with Solvency II ratio at or below 120%.
The chart below shows the Solvency II ratios of 14 solo entities between 2016 – 2023.

In all but four of the companies the lowest reported ratio is in 2023.
However, only one company posted progressively lower ratios each year.
As can be seen from the chart below and interactive table in most cases ratios fluctuate over time.
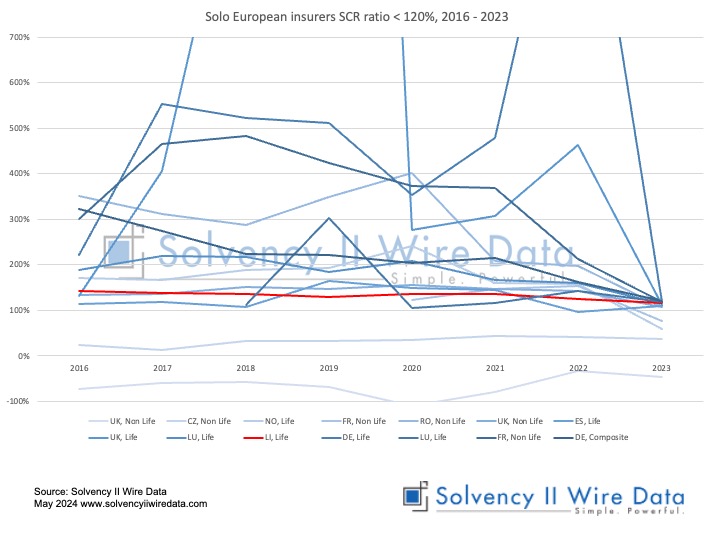
In 2017 27 companies were identified with Solvency II ratios below 100%, Insurance run-off and Solvency II, more firms sail close to the wind.
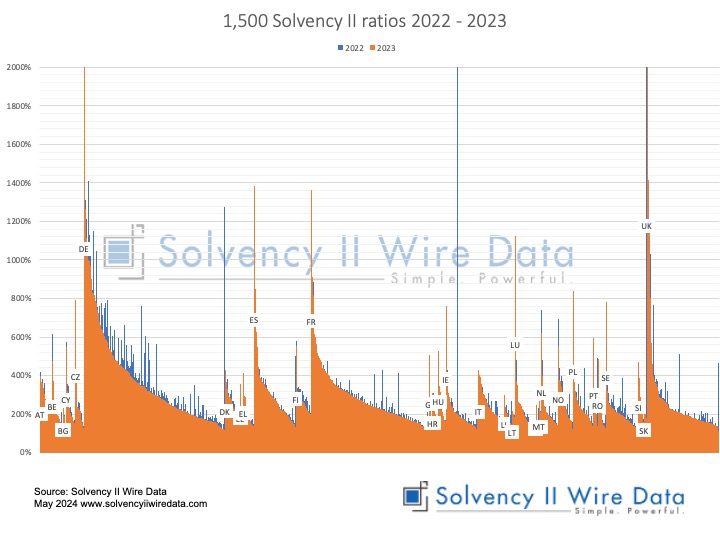
2023 Solvency II ratios across Europe
The chart below shows the distribution of 2023 Solvency II ratios of solos and groups by country relative to 2022.
Further analysis of 2023 SFCRs published by Solvency II Wire Data:
- German SCR ratio down in 2023
- European insurance market insights 2023: 1,000 QRTs fully processed
- European insurance market insights 2023: 1st 500 QRTs
- SFCR 2023: LV= returns to tier 3 capital
- Drivers of Solvency II ratio change 7 European insurance groups 2022 – 2023
More information about the data is available to premium subscribers of Solvency II Wire Data and subscribes to Solvency II Wire‘s exclusive SFCR Spotlight mailing list (subscribe for free here).
Datasets available on Solvency II Wire Data
-
- Swiss Solvency Test (SST): all available data 2016 – 2022
-
- Bermuda Financial Conditions Reports (BSCR): all available data 2016 – 2022
-
- Bermuda Financial Statements: data for 226 insurers 2016 – 2022 (1090 reports) selected tables
-
- Israel Economic Solvency Ratio Reports: all available data 2016 – 2022
-
- Lloyd’s Syndicate filings: data for 143 syndicates 2016 -2022 (767 reports) selected tables
-
- SOLVENCY II WIRE DATA Captive Hub