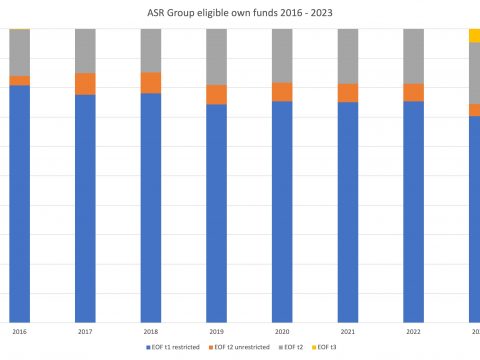
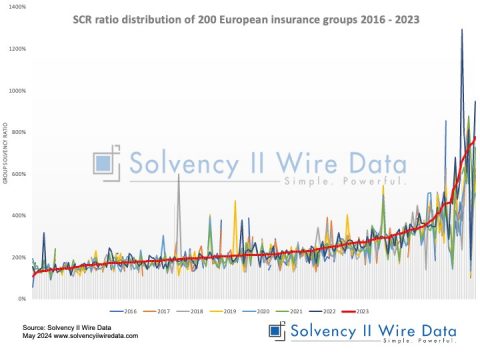
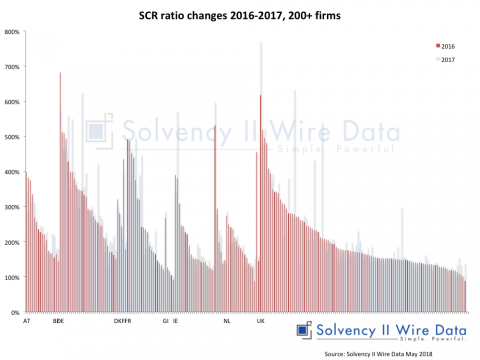
QRT data extracted from first 1,000 SFCR reports of European insurers for year end 31 December 2023 shows SCR ratios have remained stable.
Solvency II Wire Data extracted the data from all available QRT templates of 1,000 SFCRs, including 55 group reports in record time – just over two weeks since the official publication date.
The chart below shows the distribution of SCR ratios by entity type and line of business.
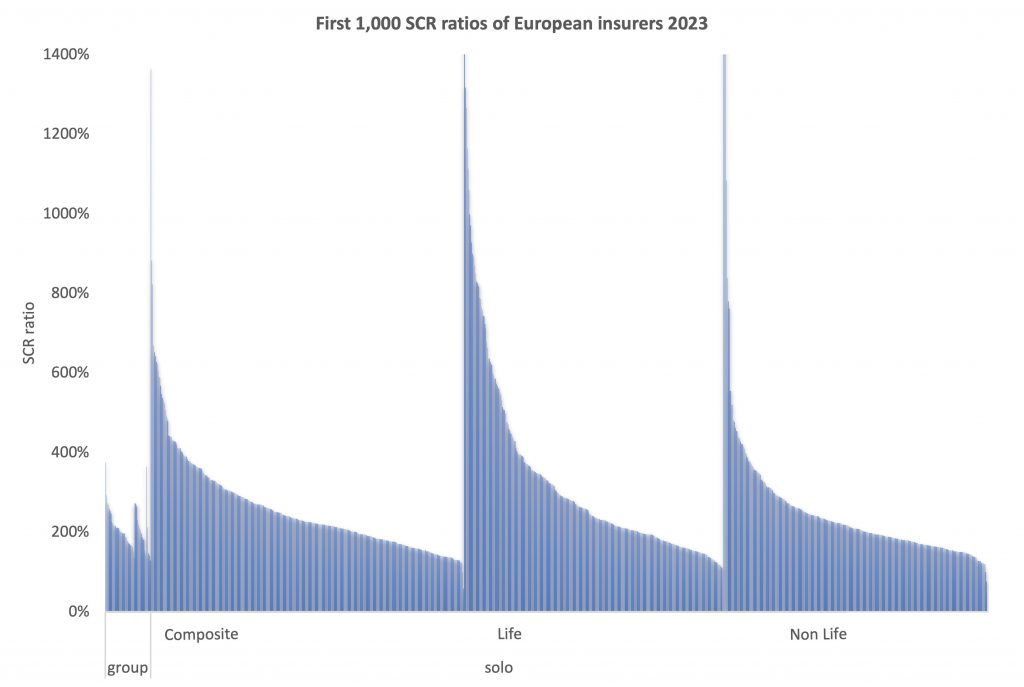
The average ratio for the sample in 2023 was 277%, virtually unchanged from 2022 (276%). It appears to be in line with the findings from the first 500 2023 QRTs available in the Solvency II Wire Data database.
Changes in Solvency II capital models
Three entities in the sample have changed their SCR calculation method.
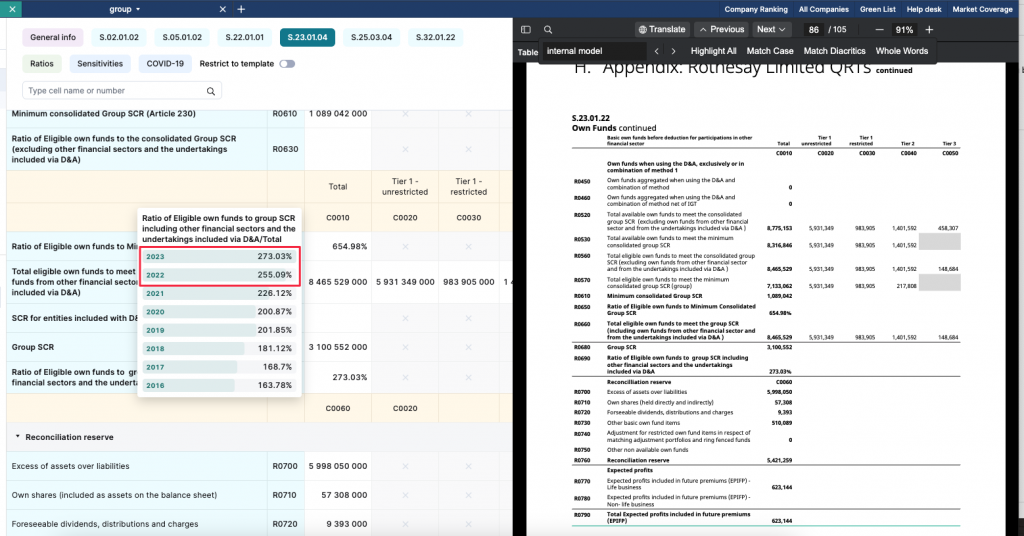
Rothesay Holdco UK and its solo entity Rothesay Life Plc received PRA approval to use a Full Internal Model (FIM) from June 2023.
According to the group SFCR: “Adoption of the FIM led to an increase in surplus of £119m as at the date of adoption.
The groups’ Solvency ratio rose from 255% in 2022 to 273% following the model change (see below). The Rothesay Life Plc Solvency II ratio also rose, from 258% to 276% respectively.
An emerging picture of the European insurance market in 2023
The findings of the QRT data add to finding in trends in European insurance risks 2016 – 2023 conducted from full text analysis of over 1,300 SFCR reports, gradually building a picture of the state of European insurance market in 2023.
Further analysis of 2023 Solvency II reporting of individual insurance groups has also been published by Solvency II Wire Data:
More information about the data is available to premium subscribers of Solvency II Wire Data and subscribes to Solvency II Wire‘s exclusive SFCR Spotlight mailing list (subscribe for free here).
Datasets available on Solvency II Wire Data
-
- Swiss Solvency Test (SST): all available data 2016 – 2022
-
- Bermuda Financial Conditions Reports (BSCR): all available data 2016 – 2022
-
- Bermuda Financial Statements: data for 226 insurers 2016 – 2022 (1090 reports) selected tables
-
- Israel Economic Solvency Ratio Reports: all available data 2016 – 2022
-
- Lloyd’s Syndicate filings: data for 143 syndicates 2016 -2022 (767 reports) selected tables
-
- SOLVENCY II WIRE DATA Captive Hub

