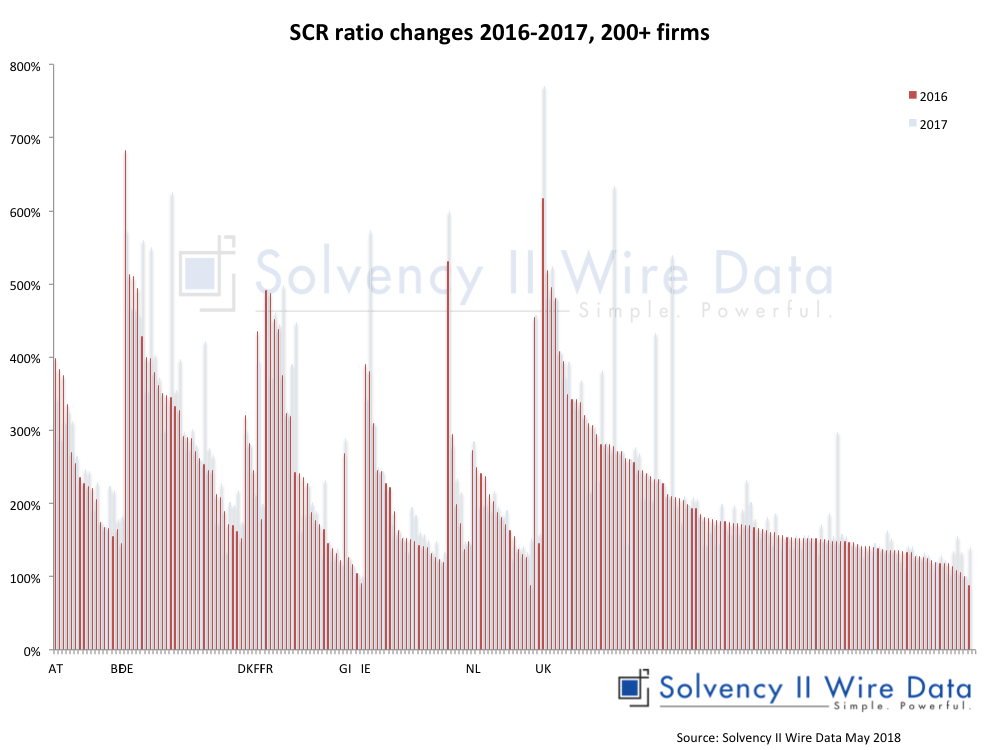
Shifts in SCR ratios 2016-2017
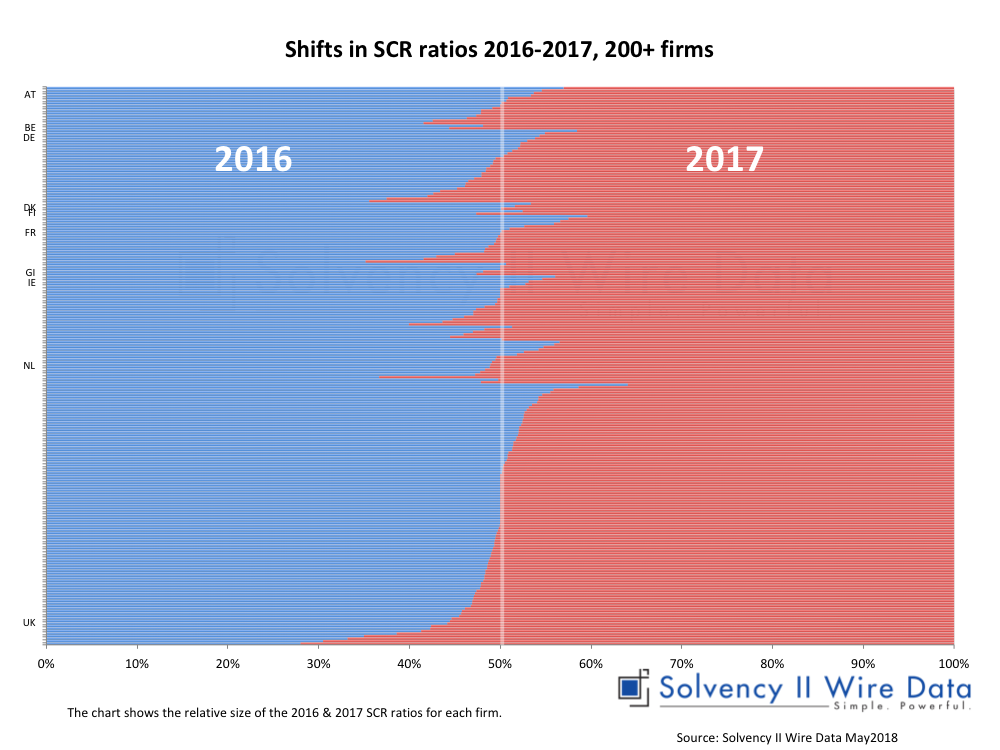
The following chart show the same changes in relative terms (100% bar chart). The white line represents the 50% mark. The breach in the line represents the percentage shift in the ratio.
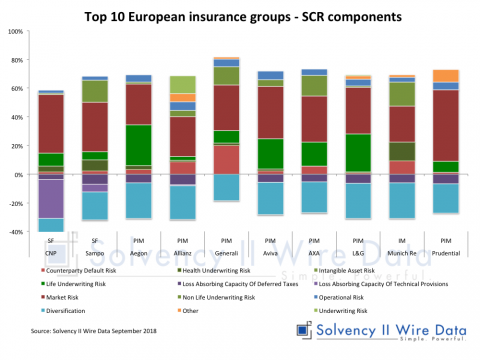
More analysis of SCR ratios of European Insurance Groups
Shift in Eligible Own Funds vs change in SCR Ratio: 95 European insurance groups
Solvency II Group Structure: solos and all entities
Shift in SCR ratios 59 European Insurance Groups 2016 – 2019
The full set of data is available to premium subscribers of Solvency II Wire Data. Find out more here.
Solvency II Wire Data Benchmarking tool

Finding French insurers with more than €1 billion total liabilities