Chart showing changes in the Solvency II SCR ratios of 100 largest UK solo insurance companies between 2016 and 2018.
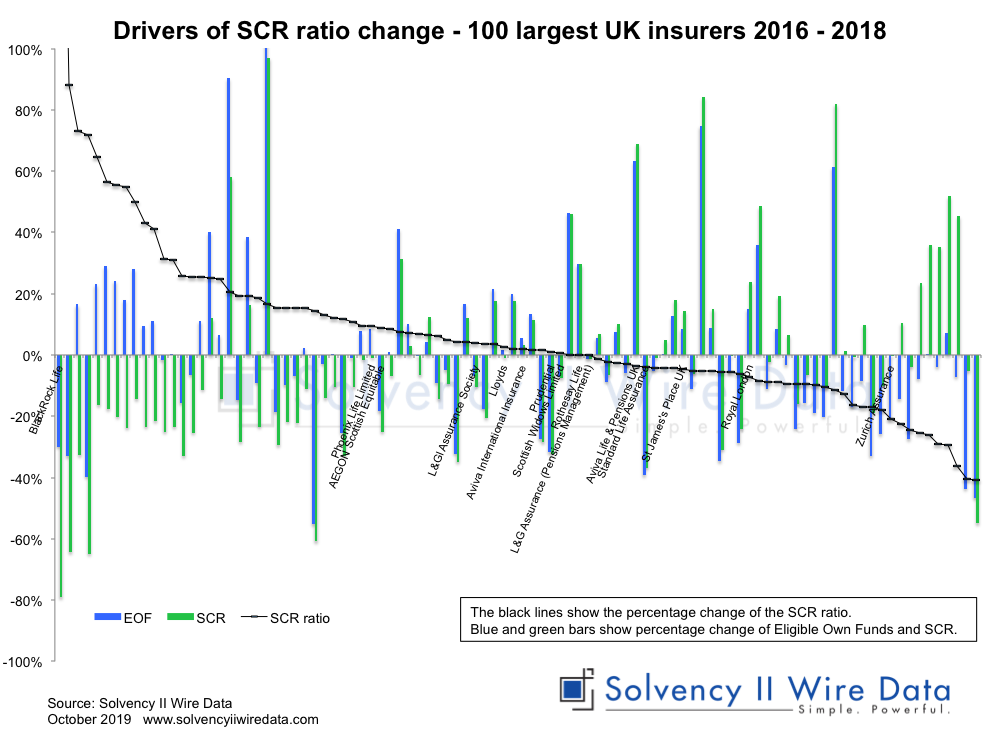
The data for this analysis was provided by Solvency II Wire Data.
Market coverage figures are subject to change as some companies have not yet published Solvency II public disclosures.
The Full set of QRTs for all data in charts is available to Solvency II Wire Data subscribers. Click here to find out more.
Solvency II Wire collects all available public QRT templates for group and solo.
Group templates available on Solvency II Wire Data
S.02.01 Balance sheet
S.05.01 Premiums, claims and expenses Life & Non-life
S.05.02 Premiums, claims and expenses by country Life & Non-Life
S.22.01 Impact of long term guarantees and transitional measures
S.23.01 Own funds
S.25.01 SCR Standard formula
S.25.02 SCR Standard Formula Partial Intern ModelS
S.25.03 SCR Standard Formula Intern Model
S.32.01 Undertakings in the scope of the group