Analysis of the first 160 European group SFCRs for the year ending 31 December 2021 processed by Solvency II Wire Data, point to increases in capital strength and growth of the balance sheet.
European insurance groups total assets
The total asset size of the sample rose from EUR 9.4 trillion in 2020 to EUR 10.1 trillion in 2021. The total asset figure for the entire group market in 2020 was EUR 11.7 trillion according to the EIOPA annual statistics (362 groups).
Group own funds 2021
The size of the eligible own funds of the sample (Total eligible own funds to meet the group SCR (including own funds from other financial sector and from the undertakings included via D&A, S23.01.04_R0660_C0010)) rose from EUR 889.8 billion in 2020 to EUR 966.8 billion in 2021 (EUR 1.2 trillion, EIOPA 2020).
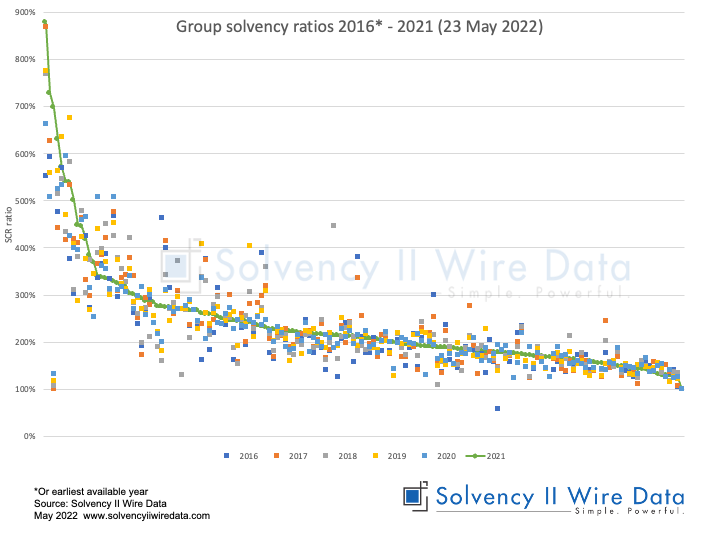
Group Solvency II ratios – on the rise
The chart below shows the distribution of group SCR ratios for the sample (solid line) and year-on-year changes since 2016 (or earliest available year), giving some indication of ratio volatility over time.
Strength in partial and full internal model
The sample consists of 130 standard formula firms, 20 partial internal model firms and 10 internal model firms.
Just over half of all standard formula firms reported an increase in their ratio over the period. While 18 of the 20 partial internal model firms and 7 of the 10 the internal model firms (90% and 70% respectively) reported an increase in their group ratio.
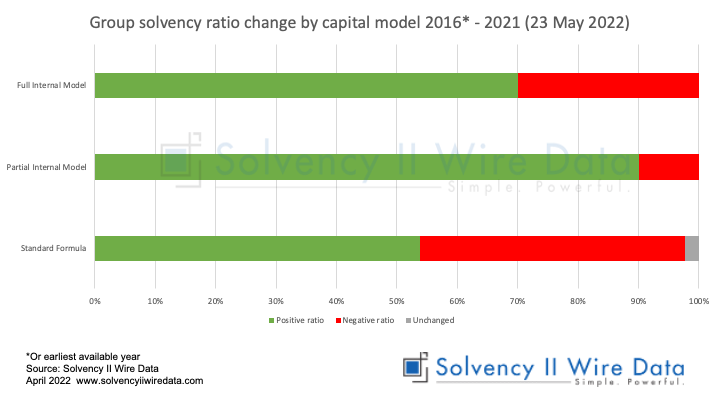
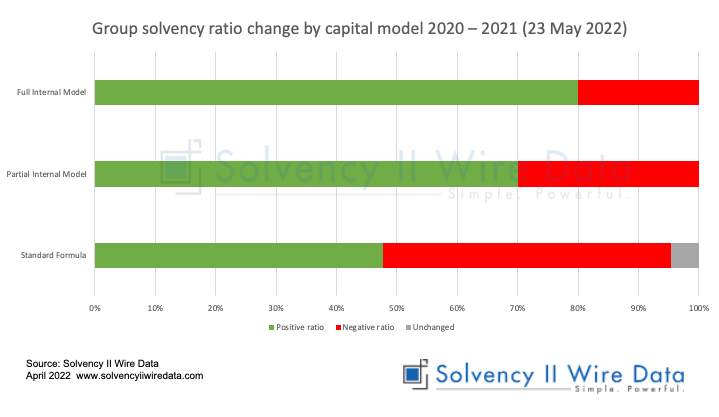
Ratio change by capital model 2020 – 2021.
Looking at the changes in ratio from last year, just under half of all standard formula firms reported an increase in their ratio since 2020. While 14 of the partial internal model firms and 8 of the internal model firms (70% and 80% respectively) reported an increase in their group ratio.
Conclusion
As with the solo entities, the early analysis of the group Solvency II disclosures suggests an overall increase in capitalisation of the European market, albeit with the usual caveats on differences between individual firms and countries.