State of the European insurance market 2021
The following report on the state of the European insurance market in 2021 is based on the data processed by the Solvency II Wire Data European insurance database in the first 30 days since publication of the 2021 Solvency II public disclosures.
As of 8 May 2022 a total of 1,578 QRTs were fully processed: 1,502 solo and 76 group reports. Solo market coverage EUR 11.8 trillion total assets.
Data extracted from SFCR text: market sensitivities 139 reports, SCR components 72 reports.
Solo 2021 European insurance data
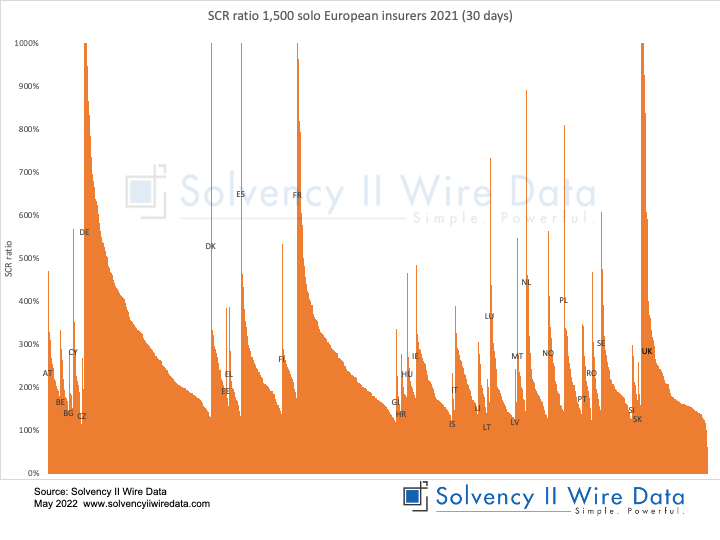
The average SCR ratio for the solo sample increased from 232% in 2020 to 242% in 2021. The figure for the entire solo market in 2020 according to the EIOPA annual statistics was 235%.
The chart below shows the distribution of SCR ratios by country.
European insurance market size by total assets
The sample represents EUR 11.8 trillion assets under management, a 5% increase from the previous year figure of EUR 11.2 trillion (EUR 13.4 trillion, EIOPA 2020).
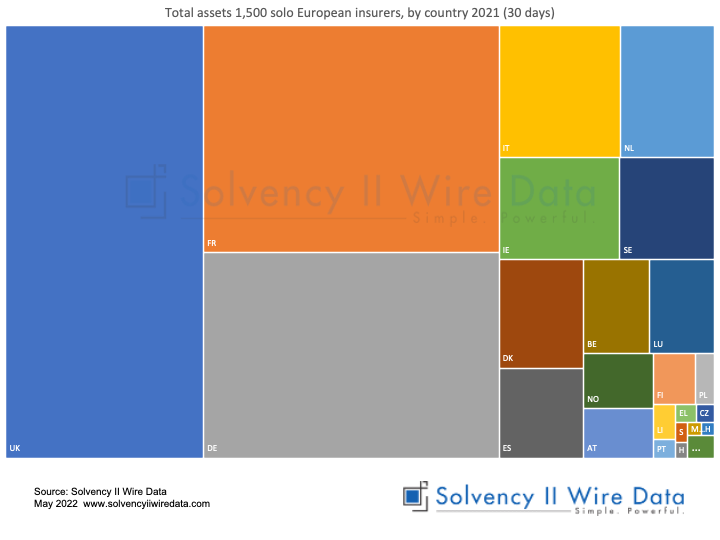
The UK reported EUR 3.3 trillion total assets (EUR 3.04 trillion, EIOPA 2020), followed by France EUR 2.6 trillion (EUR 3.08 trillion, EIOPA 2020) and Germany EUR 2.3 trillion (EUR 2.5 trillion, EIOPA 2020).
Eligible own funds distribution by country
The sample reported EUR 1.5 trillion in eligible own funds to meet the SCR (EOF), a 7% increase from the EUR 1.4 trillion reported in 2020 (EUR 1.8 trillion, EIOPA 2020).
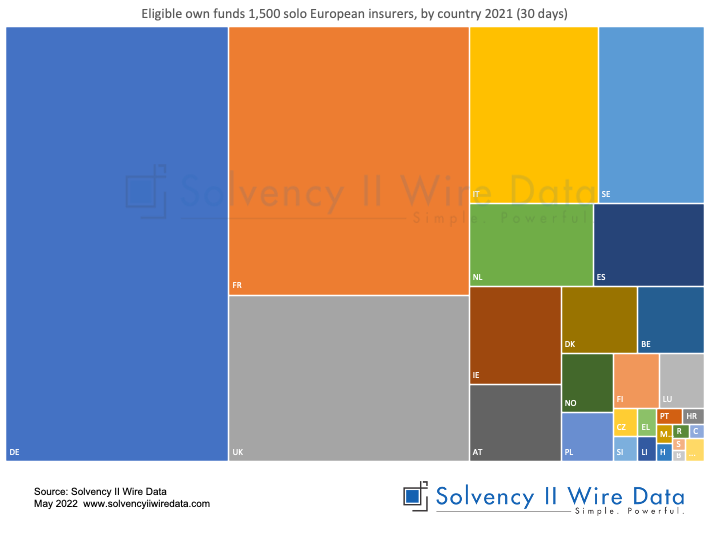
Germany reported EUR 496 billion EOF (EUR 563 billion, EIOPA 2020), followed by France EUR 330 billion (EUR 411 billion, EIOPA 2020) and the UK EUR 204 billion (EUR 201 billion, EIOPA 2020).
SCR distribution by country
The sample reported a Solvency Capital Requirement (SCR) of EUR 635 billion, a 4% increase from EUR 609 billion in 2020 (EUR 772 billion, EIOPA 2020).
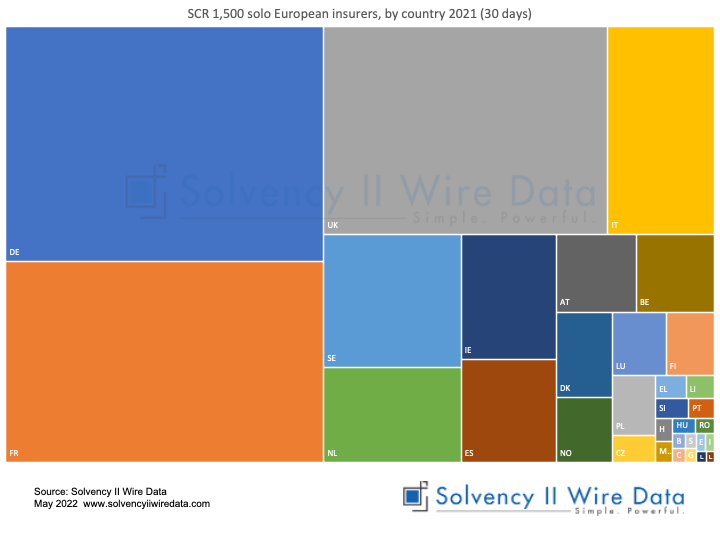
Germany reported and SCR of EUR 155 billion (EUR 188 billion, EIOPA 2020), followed by France EUR 132 billion (EUR 169 billion, EIOPA 2020) and the UK EUR 123 billion (EUR 129 billion, EIOPA 2020).
Tiering of Own Funds by country
The chart below shows the distribution of EOF by the four capital tiers for the sample between 2020 and 2021.

The figures closely match the EIOPA annual statistics for 2020 (see table below).
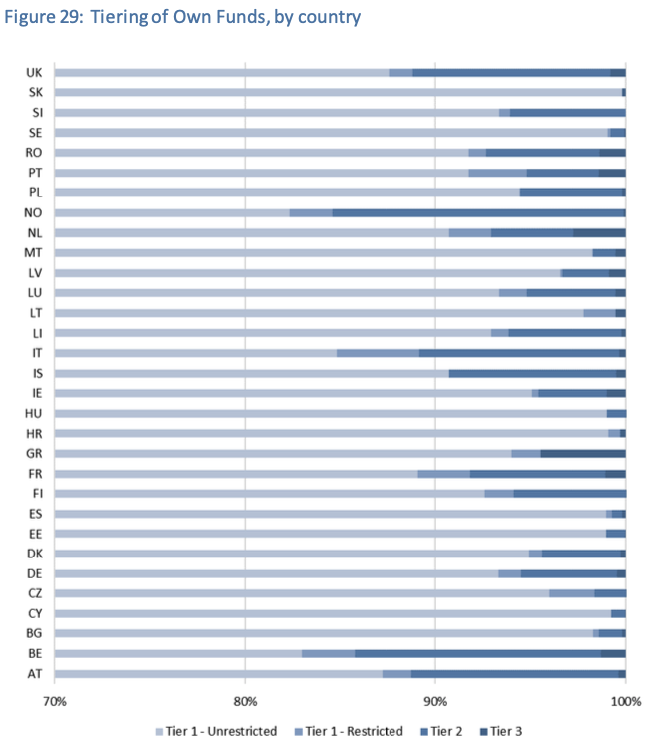
EIOPA highlights that Norway and Belgium held the lowest proportion of Tier 1 unrestricted capital in 2020. While the sample closely matches the figures for Norway in 2020 (81% compared to EIOPA’s 83%) it suggests a lower proportion (78%) in 2021.
In contrast the sample for Belgium (84% compared to EIOPA’s 83% in 2020) suggests an increase to 86% in 2021.
The sample also suggests that the level of Tier 3 capital help by Greece in 2021 may reduce from 4% in 2020.
Insurance groups early analysis
To date 76 European insurance groups published their 2021 SFCRs (ahead of the official publication date 20 May).
The average SCR ratio for the sample rose from 190% in 2020 to 202% in 2021.
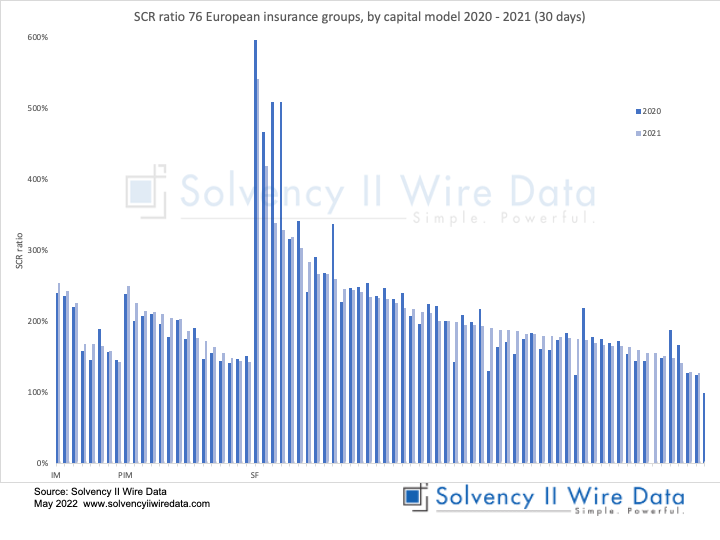
75% of the groups reported a year-on-year increase in their ratio. This proportion is broadly kept across the different capital models used by the firms in the sample: 8 internal model, 15 partial internal model and 52 standard formula firms.
2021 European insurance trends detected in the SFCRs
Full text search of the 2021 SFCRs points to emerging trends on the European insurance risk radar.
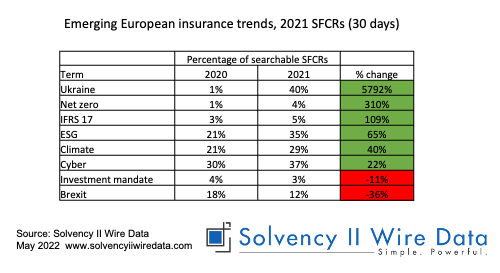
Unsurprisingly the war in Ukraine features in many SFCRs (40% of searchable reports), as do climate related themes such as net zero and ESG, while interest in Brexit is significantly lower than in 2020 (12% of reports compared to 18% in 2020).
Fewer than 1% of reports in both years featured information on the three new emerging risks identified by the CRO forum last year: biodiversity, mental health and social-economic inequalities.
The figures are subject to change and may be influenced by factors such as language (only English was used in this search) and the weighting of each country. However, they do seem to point to some clear emerging trends.
Early analysis of the 2021 European insurance market
The Solvency II Wire Data 30 day report – 2021 provides early insights on the state of the European insurance market, based on the annual Solvency II public disclosures, ahead of any of the official publications by EIOPA and other national regulators.
The report points to an overall strengthening of capital position of the market as well as a growing awareness of existing and some emerging risks.
As has been shown elsewhere, the aggregate figures can mask significant differences between individual insurers and markets. At the same time the figures provide valuable insights into the overall trends of insurance in Europe.
Solvency II Wire Data is an innovative insurance database of the Solvency II SFCR data provided by Solvency II Wire.
To view a list of features see the Solvency II Wire Data Innovation Timeline.