Capital optimisation under Solvency II remains an important topic for insurers.
The extent to which firms can reduce the proportion of tier 1 restricted capital in their Eligible own funds to meet the SCR is an important part of capital management.
The chart shows the shift in the capital structure of a sample of 26 European insurance groups that published their Solvency II disclosures ahead of the official publication date in 2022.
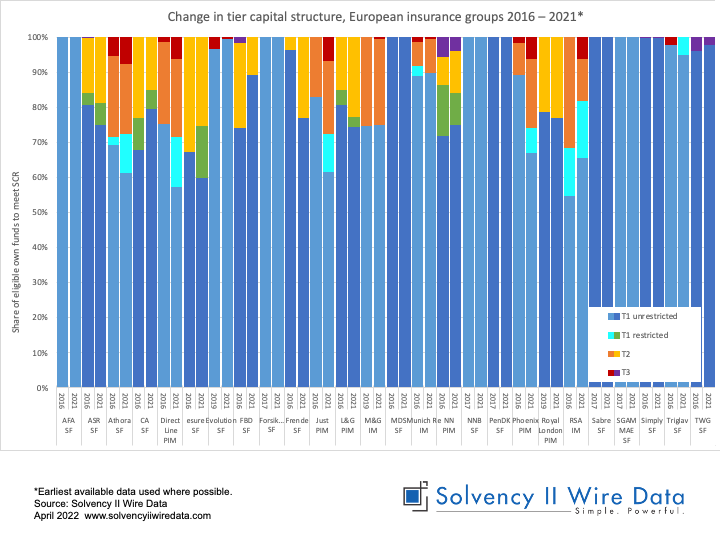
Most of the groups in the sample (19) reduced the proportion of tier 1 restricted capital between 2016 (or earliest available year) and 2021.
The sample seems to suggest that there isn’t a distinct advantage of using an internal model or partial internal model in reducing tier 1 unrestricted capital; all but 3 of the 19 firms use the standard formula.
Of those groups that increased the use of tier 1 restricted capital, two use an internal model (Munich Re and RSA) and one a partial internal model (NN).
It is also evident that the use of tier 3 capital remains relatively limited.
The full data set (QRTs and SFCRs) for +350 European insurance groups is available on Solvency II Wire Data.