Early analysis of the 2021 Solvency II public disclosures of European insurers points to an increase in capital strength of the industry.
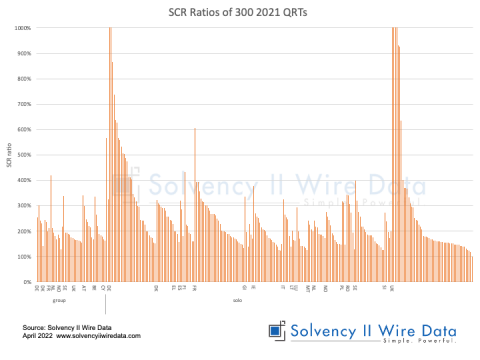
The average SCR ratio of the first 1,000 solo insurers processed by Solvency II Wire Data increased from 234% in 2020 to 244% in 2021. The figure for the entire solo market in 2020 according to the EIOPA annual statistics was 235%.
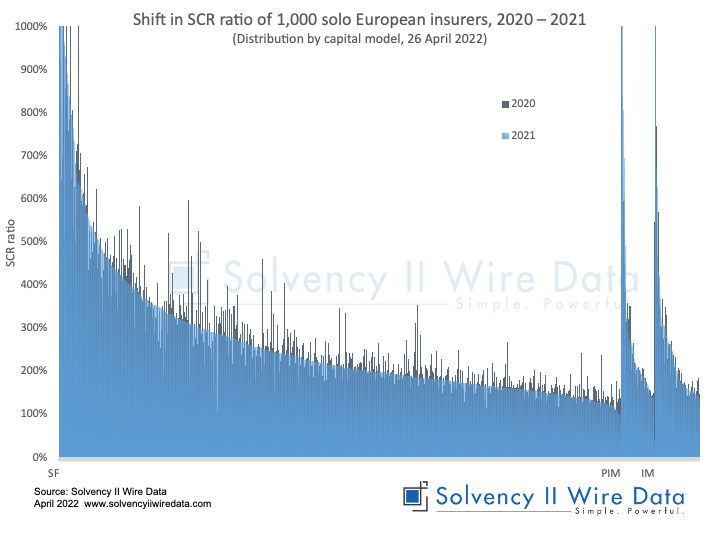
The chart below shows the distribution of SCR ratios for 2020 and 2021 by method of SCR calcluation.
Sample details
The sample distribution by line of business is as follows: 26% non-life, 33% life and 41% composite.
The total asset size of the 2021 sample is EUR 10.5 trillion, compared to EUR 10.1 trillion in 2020 (EUR 13.4 trillion, EIOPA 2020).
The Solvency Capital Requirement (SCR) of the sample increased by 3% from EUR 495.8 billion in 2020 to EUR 511.7 billion the following year (EUR 772.1, EIOPA 2020).
Eligible own funds to meet the SCR (EOF) rose by 8% from EUR 1.16 trillion to EUR 1.25 trillion respectively (EUR 1.81, EIOPA 2020).
The bigger increase in the EOF is likely the main driver of the rise in the SCR ratio of the sample.
Internal model capital efficiency
The average SCR ratio of a sample can mask significant variations in the ratios of individual companies. However, the sample was broadly evenly split between those insurers that reported an increase and those that reported a decrease in their 2021 ratios. Four firms maintained the same ratio.
Standard Life Pension Funds Limited reported the highest ratio in 2021: 2944%, a substantial increase from 548% in 2020. The increase was largely due to a drop in the company’s SCR and a moderate increase in its EOF. The change also represents the largest year on year increase in the SCR ratio for the sample.
The lowest ratio in the sample, 44% was reported by Exportní garanční a pojišťovací společnost, a.s. (CZ); an increase from 34% reported in 2020. However, the largest drop in ratio was reported by Lemonade Insurance (NL) from 597% in 2020 to 313% in 2021.
Is an internal model worth it?
A perennial question asked in Solvency II circles is if the use of an internal model (or partial internal model) is more effective at reducing a firm’s capital requirement when compared to the standard formula.
The sample includes 70 internal model firms and 52 partial internal model firms.
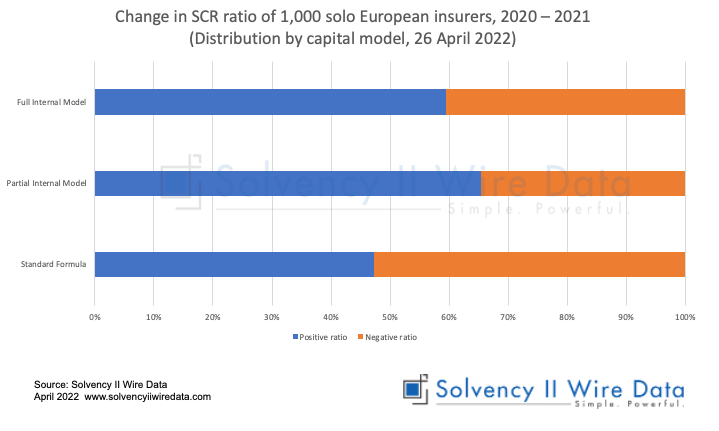
While a little less than half of the standard formula firms reported an increase in their 2021 ratios, 59% of the internal model firms and 65% of the partial internal model firms reported an increase in ratio. The figures support the view that using a partial or full internal model has a positive correlation with an increase in a firm’s SCR ratio.
European insurance market analysis 2021
Analysis of figures from 1,000 SFCR reports points to an increase in capital strength of European insurers in 2021. While the sample represents a significant proportion of total assets managed by the industry, it only accounts for about one third of solo insurers. As these are likely to be smaller firms, often serving specific communities, the depth of this initial strength remains to be seen.