Analysis of NN Group Solvency II public disclosures
NN Group is the first of the large European insurance groups to publish its Solvency II public disclosures (SFCR and QRTs).
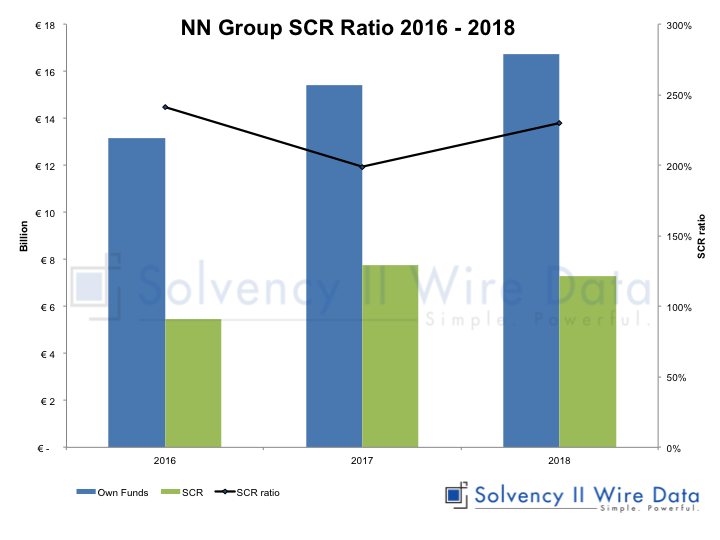
The 2018 NN Group SCR ratio – commonly referred to as the Solvency II ratio – is 230{%, a 16% increase from last year. However it falls short of its 2016 ratio of 241% (see chart below).

The company explained the change in the ratio as follows: “Solvency II ratio of 230% reflects changes in the corporate tax rate in the Netherlands, the impact of the final dividend and the termination of the warrant agreement as well as negative equity revaluations, partly offset by the expansion of the Partial Internal Model and operating capital generation.”
The chart also shows that the main drivers increasing the ratio in 2018 were a 9% increase in Own Funds to EUR 16.7 bn (EUR 15.4 bn in 2017) and a -6%decrease in the Solvency Capital Requirement (SCR) to EUR 7.3 bn (EUR 7.7 bn in 2017).
Since 2016 the group’s Own Funds have increased steadily rising by 27% over the period. The SCR rose significantly in 2017 causing the drop in SCR ratio (199%) but its subsequent decrease in 2018 has helped to bring the ratio closer in line with the initial figure in 2016.
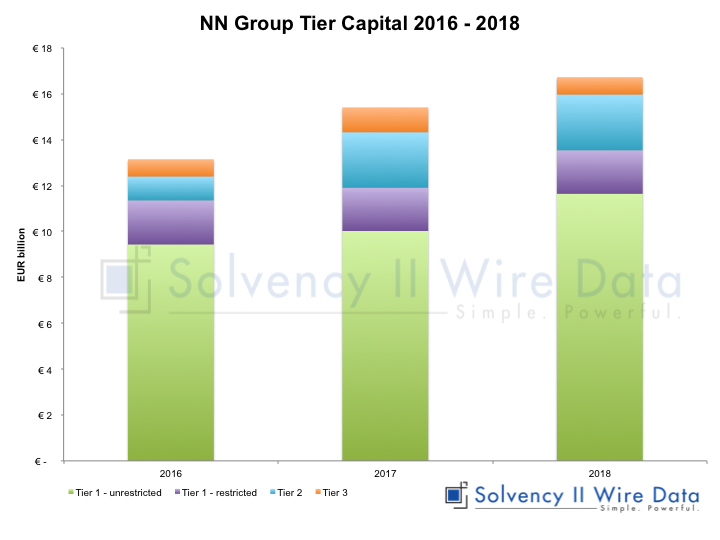
Analysis of the group’s tier capital structure of the Own Funds (see chart below) shows that Unrestricted Tier 1 capital increased by 16% from 2017 (23% since 2016). Tier 2 capital remained stable in 2018, following a 132% increase in the first year, while Tier 3 capital decreased by -30% in 2018, bringing it back in line with the 2016 figure.

NN Group is the 12 largest insurance group in Europe by Total Assets based on the Solvency II balance sheet (see table below).

—

Our Solvency II Wire Data database gives you unparalleled access to the Solvency II public disclosures.


