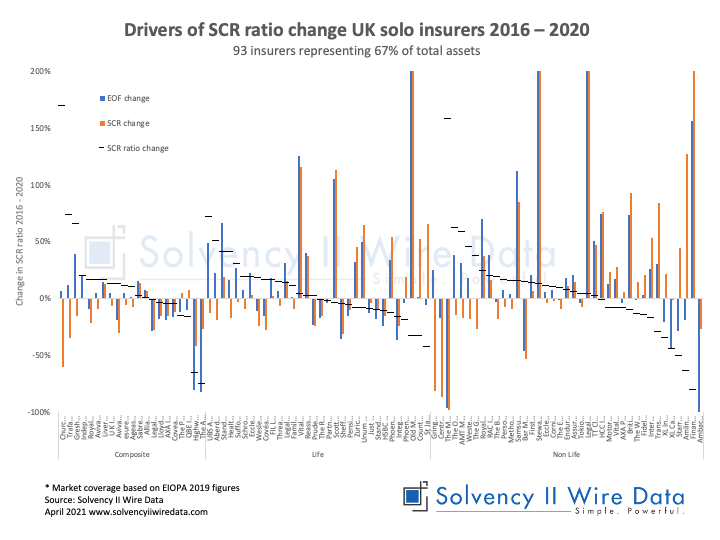
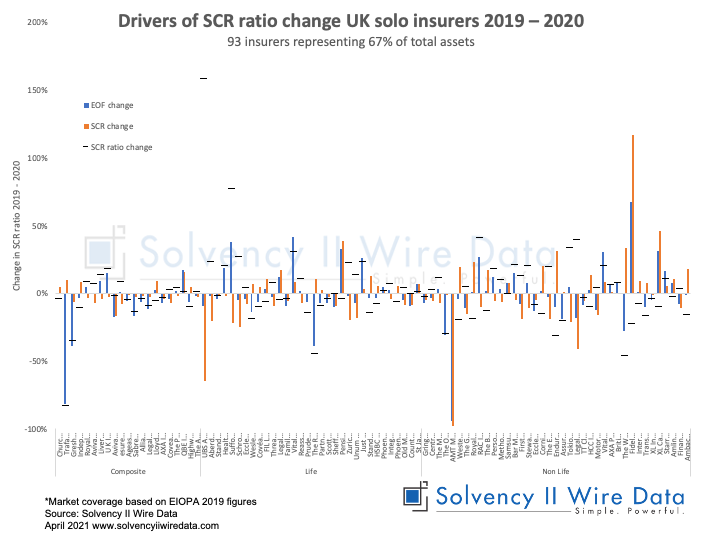
The charts below show the drivers of insurance risk change in the Solvency II ratios of 93 UK solo insurers in 2020.
The change in the Solvency II (horizontal lines) is plotted agains the respective changes in the amount of Eligible Own Funds and Solvency Capital Requirement (blue and orange bars respectively).
The sample of 93 UK solo insurers represents 67% of total assets of the UK market based on the latest available figures from EIOPA in 2019.
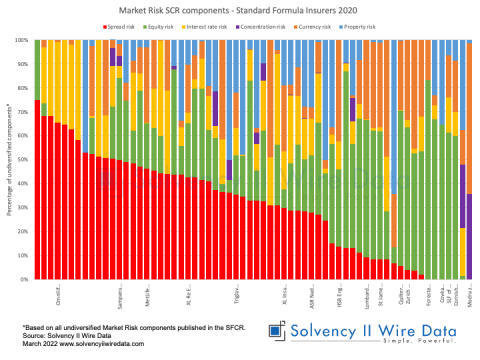
Solvency II Wire Data collects all available public QRT templates for group and solo.