500 2020 QRTs packed with insurance data

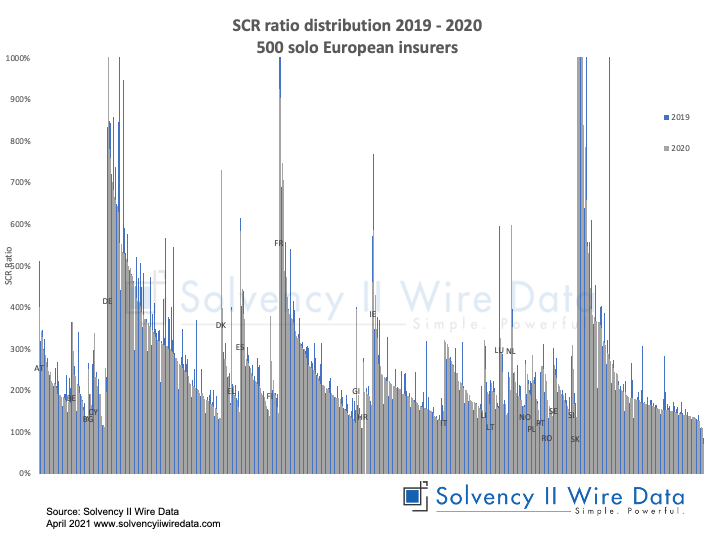
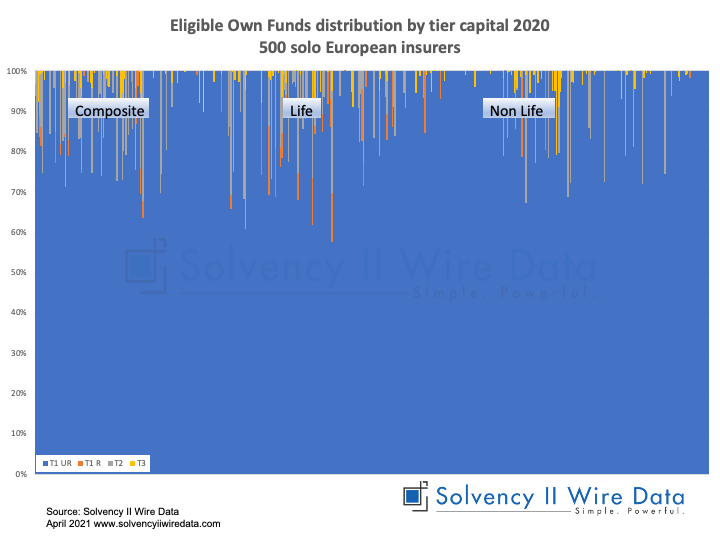
Insurance data of a sample of over 500 Solvency II QRTs show the distirbution of Solvency II ratios in the 2020 public disclosures.

Chart showing insurance data of SCR ratio distribution

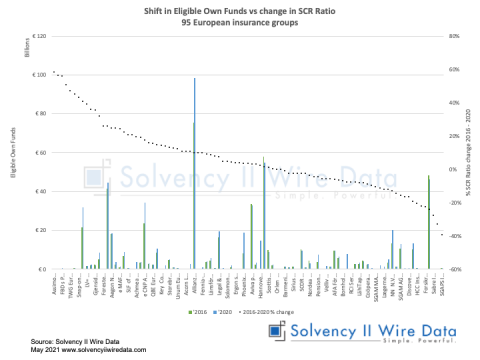
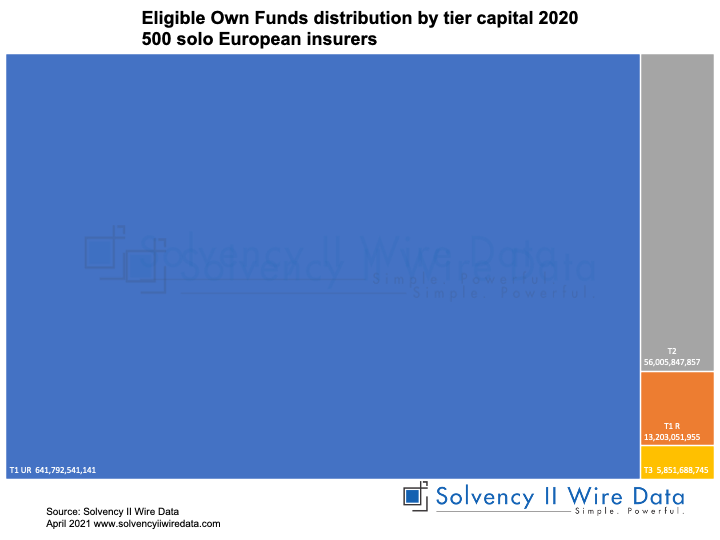
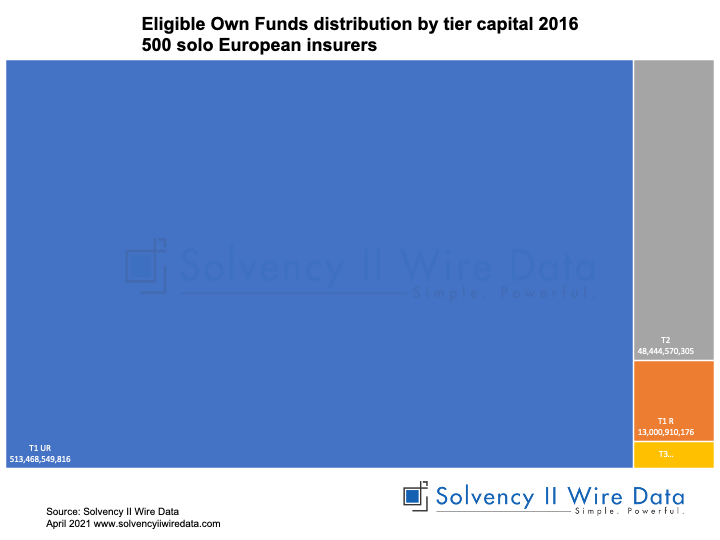
Data on the amount of Eligible Own Funds (EOF) to cover the Solvency Capital Requirement (SCR) shows that tier capital distribution remains stable between 2016 – 2020.

Chart showing insurance data of Eligible own funds distribution
Chart showing insurance data of eligible own funds distribution by line of business in 2020 SFCR reports
Chart showing insurance data of eligible own funds distribution by line of business in 2016 SFCR reports

Solvency II Wire Data collects all available public QRT templates for group and solo.

Link to The path to Solvency II Wire Data banner