European insurance market insights from the first 500 SFCRs and QRTs published by European insurers for the financial year 2023 shows a slight upward trend in solvency ratios and eligible own funds.
Solvency II Wire Data has collected and extracted the full QRT data from over 500 solo insurers and 50 groups (one week since their official publication date on 7 April). A total of 1,100 Solvency and Financial Condition Reports (SFCR) are already available on the platform.
The sample of solo entities has a combined total asset value of EUR 5,540 billion a slight increase on the previous year (EUR 5,537 billion).
In 2022 the total market value according to EIOPA official statisitics was EUR 9,395 billion. However, the EIOPA figures no longer include the UK, which is available in the Solvency II Wire Data sample.
2023 SCR ratios slightly up
The average SCR ratio of the sample is 240%, almost unchanged relative to 2022 (237%).
The chart below plots the solvency ratios in 2023 (red line) relative to 2022 (blue line).
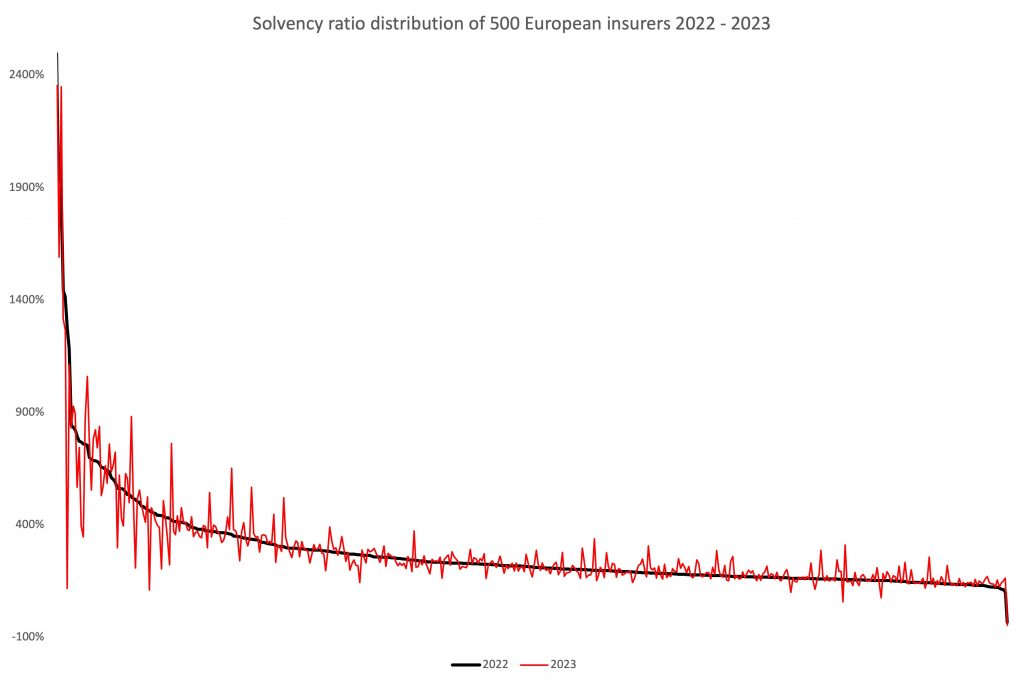
The distribution of ratio changes is fairly evenly split. 55% of the sample reported an increase in their solvency ratio between 2022 and 2023.
Eligible capital increases in 2023
The total Eligible Own Funds (EOF) to meet the Solvency Capital Requirement (SCR) of the sample rose from EUR 683 billion in 2022 to EUR 691 billion in 2023.
72% of firms reported an increase in the EOF over the period.
By contracts the SCR of the sample dropped from EUR 288 billion in 2022 to EUR 287 billion in 2023 and only 66% of the sample reported an increase in the SCR.
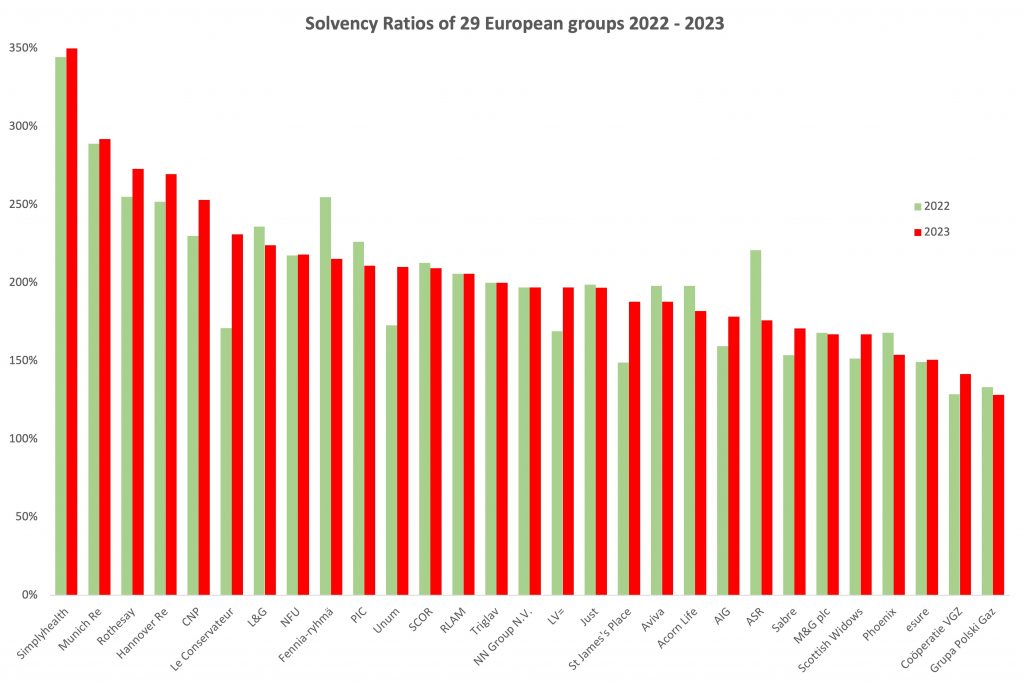
2023 European insurance groups
The chart below the changes in solvency ratios of 29 European insurance groups between 2022 – 2023.
European insurance market insights 2023
The sample of companies represented in this report of European insurance market insights is based on priority collection of data as requested by users of Solvency II Wire Data. As such they are a work in progress and the final findings once the full dataset of Solvency II public disclosures is processed.
However, in the past the samples have been a good bellweather for the state of the market; see Official figures confirm total assets drop of European insurance groups.
Further analysis of Solvency II reporting of individual insurance groups has also been published by Solvency II Wire Data:
- ASR introduces tier 3 capital
- L&G solvency ratio down
- LV= returns to tier 3 capital
- NN Group solvency ratio unchanged
- Drivers of Solvency II ratio change 7 European insurance groups 2022 – 2023
More information about the data is available to premium subscribers of Solvency II Wire Data and subscribes to Solvency II Wire‘s exclusive SFCR Spotlight mailing list (subscribe for free here).
Datasets available on Solvency II Wire Data
- Swiss Solvency Test (SST): all available data 2016 – 2022
- Bermuda Financial Conditions Reports (BSCR): all available data 2016 – 2022
- Bermuda Financial Statements: data for 226 insurers 2016 – 2022 (1090 reports) selected tables
- Israel Economic Solvency Ratio Reports: all available data 2016 – 2022
- Lloyd’s Syndicate filings: data for 143 syndicates 2016 -2022 (767 reports) selected tables
- SOLVENCY II WIRE DATA Captive Hub