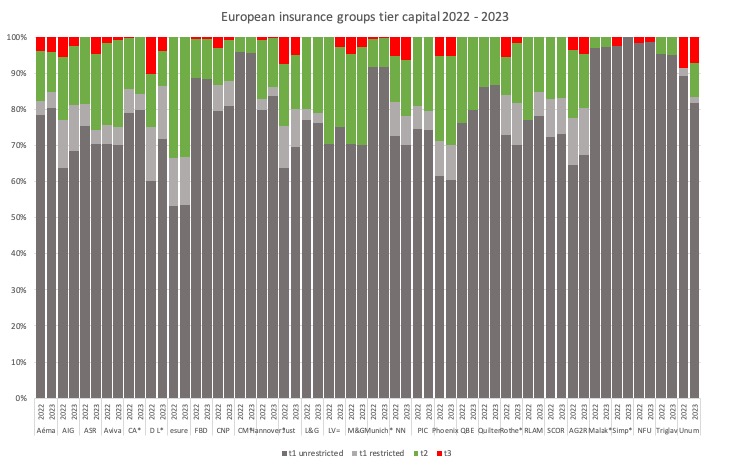
Early analysis of the Eligible Own Funds (EOF) to meet the SCR of European insurance groups in 2023 reveals an increase in overall EOF and use of tier 2 capital alongside a reduction of tier 3 capital.
The sample is based on 47 European insurance groups that have published their 2023 SFCR reports early this year and cover EUR 4,264 billion in total assets, up almost 10% from 2022 (EUR 3,898 billion).
The EOF of the sample grew by 5% year on year from EUR 352 billion to EUR 369 billion in 2023.
The tier 1 capital, both unrestricted and restricted remained relatively unchanged, with the latter increasing by 5%.
However, tier 2 capital of the sample rose by 8% to EUR 51 billion, while tier 3 capital reduced by 16% to 5 billion.
The chart below shows the shifts in tier capital for a selection of the sample.

Despite the reduction in use of tier 3 capital in the sample, the overall picture of the market is likely to be more nuanced.
For example, both LV= and ASR have increased their use of tier 3 capital in 2023.
Further analysis of 2023 Solvency II reporting of individual insurance groups has also been published by Solvency II Wire Data:
- ASR introduces tier 3 capital
- L&G solvency ratio down
- LV= returns to tier 3 capital
- NN Group solvency ratio unchanged
- Drivers of Solvency II ratio change 7 European insurance groups 2022 – 2023
More information about the data is a vailable to premium subscribers of Solvency II Wire Data and subscribes to Solvency II Wire‘s exclusive SFCR Spotlight mailing list (subscribe for free here).
Datasets available on Solvency II Wire Data
- Swiss Solvency Test (SST): all available data 2016 – 2022
- Bermuda Financial Conditions Reports (BSCR): all available data 2016 – 2022
- Bermuda Financial Statements: data for 226 insurers 2016 – 2022 (1090 reports) selected tables
- Israel Economic Solvency Ratio Reports: all available data 2016 – 2022
- Lloyd’s Syndicate filings: data for 143 syndicates 2016 -2022 (767 reports) selected tables
- SOLVENCY II WIRE DATA Captive Hub


