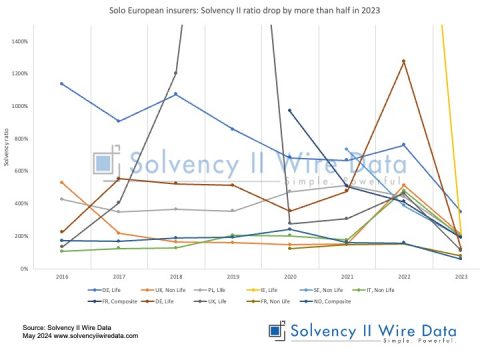
Distribution of group Solvency II ratios of 200 European insurance groups between 2016 – 2023.

Analysis of Group SFCRs 2023
SFCR 2023: Solvency II template S.25.05 partial and full internal model reporting
AXA Group reports highest Solvency II ratio to date
Eurovita portfolio transfer to Cronos Vita details
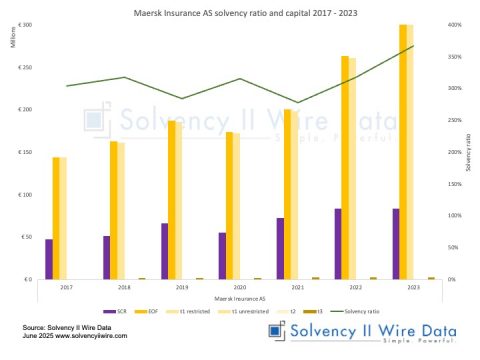
European insurance market insights 2023: group tier capital
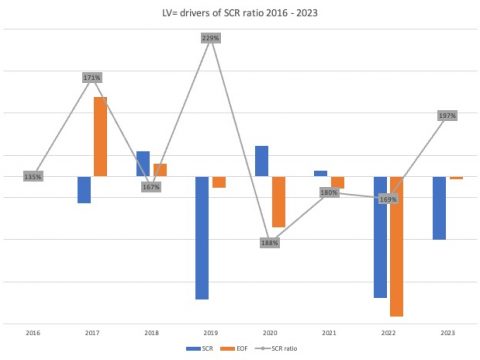
Drivers of Solvency II ratio change 7 European insurance groups 2022 – 2023
More information about the data is available to premium subscribers of Solvency II Wire Data and subscribes to Solvency II Wire‘s exclusive SFCR Spotlight mailing list (subscribe for free here).
Datasets available on Solvency II Wire Data
-
- Swiss Solvency Test (SST): all available data 2016 – 2022
-
- Bermuda Financial Conditions Reports (BSCR): all available data 2016 – 2022
-
- Bermuda Financial Statements: data for 226 insurers 2016 – 2022 (1090 reports) selected tables
-
- Israel Economic Solvency Ratio Reports: all available data 2016 – 2022
-
- Lloyd’s Syndicate filings: data for 143 syndicates 2016 -2022 (767 reports) selected tables
-
- SOLVENCY II WIRE DATA Captive Hub