ANALYSIS
In preparation for the publication of the second set of Solvency II public disclosures (SFCR and QRTs for 2017) Solvency II Wire Data continues its analysis into the understanding and interpretation of the Solvency II figures.
In this article we revisit the analysis of potential run-off targets and Solvency II figures published in the article 99 insurers sailing close to the wind (Solvency II Wire 24/10/2017).
27 firms below 100% SCR ratio
Analysis of over 2,000 solo European insurance firms subject to Solvency II public disclosures, reveals that 27 firms breached their SCR ratio as of 31 December 2016. Raising the threshold to 120% expands the sample to 130 insurers with a ratio close to, or breaching, the limit.
The chart below shows the distribution of the firms in the sample. Firms that have breached their SCR only are marked in pink, while those that have also breached the MCR are in red.
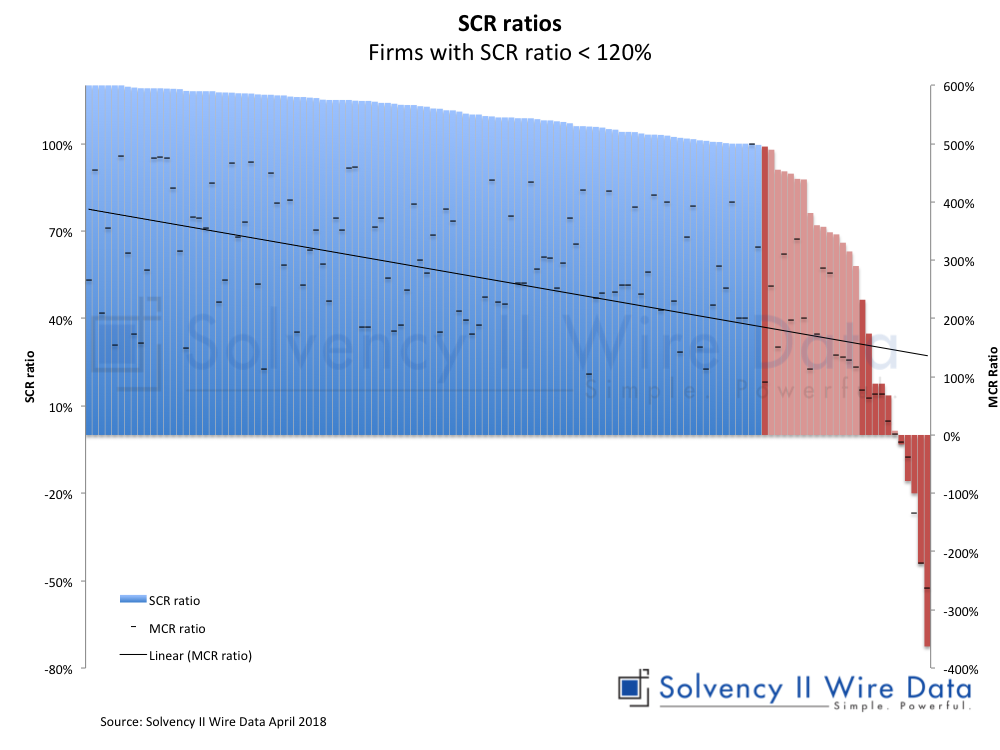
13 firms breached their MCR ratio and 5 firms have both a negative SCR as well as a negative MCR ratio. The linear trend line indicates a correlation between the SCR and MCR ratios.
Sample dominated by non life insurance firms
The geographic spread of the sample is dotted across Europe with pockets concentrated in the UK (22 firms), Gibraltar (15 firms), Ireland (13 firms) and Italy (12 firms). The majority of the firms in the sample (75 firms) are non-life insurers. Only 5 firms use either an internal model or partial internal model (unchanged from earlier sample). Throughout the sample 33 firms apply a total of 44 LTG measures (a number of firms use more than one measure).
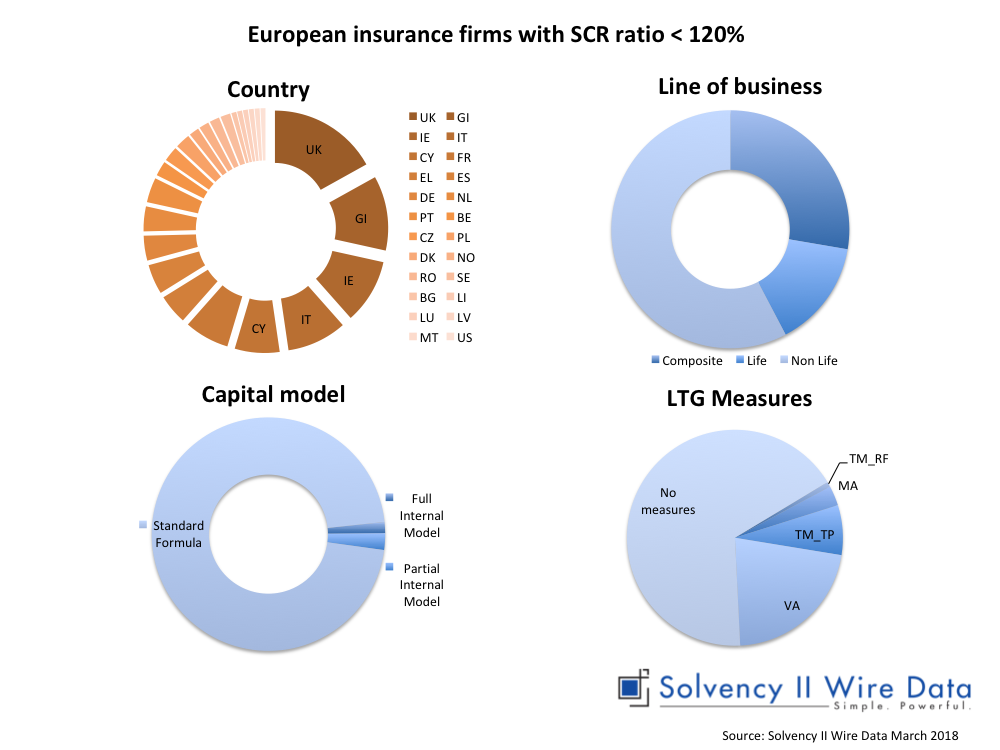
The Volatility Adjustment is used by 29 firms, 11 use some form of transitional and only 4 firms use the Matching Adjustment. The figures are in keeping with the popularity of the Volatility Adjustment across Europe.
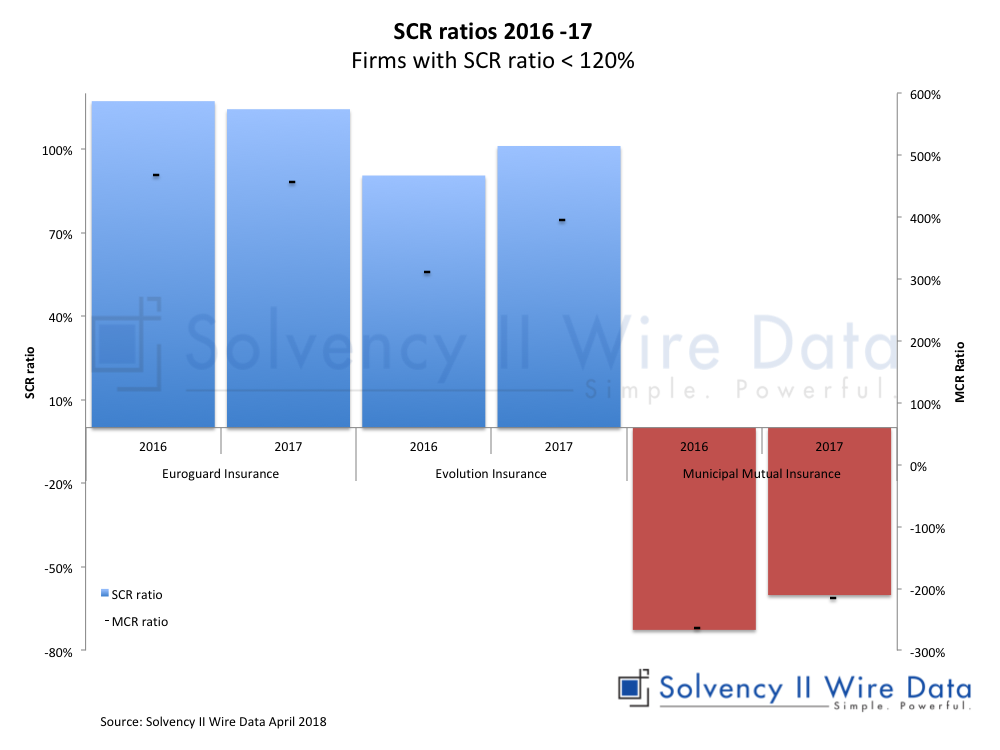
Improvements in SCR and MCR ratios
At the time of publication, 3 firms had already released their 2017 SFCRs and QRTs:
| Company | LEI | SIIW_ID* |
| Euroguard Insurance Company PCC Limited | 213800V2IS42UGIQHX49 | 65b0d7ff-53d5-421c-ae09-70f383d41188 |
| Evolution Insurance Company Limited | 2138008P6LTB2RWKB804 | ddf35d9d-b38b-4bf6-960b-fb84ce5c4fb1 |
| Municipal Mutual Insurance Limited | 213800Q4LJELSR6V9Y46 | c66f9bfc-f280-4ab5-a656-196af1bc3973 |
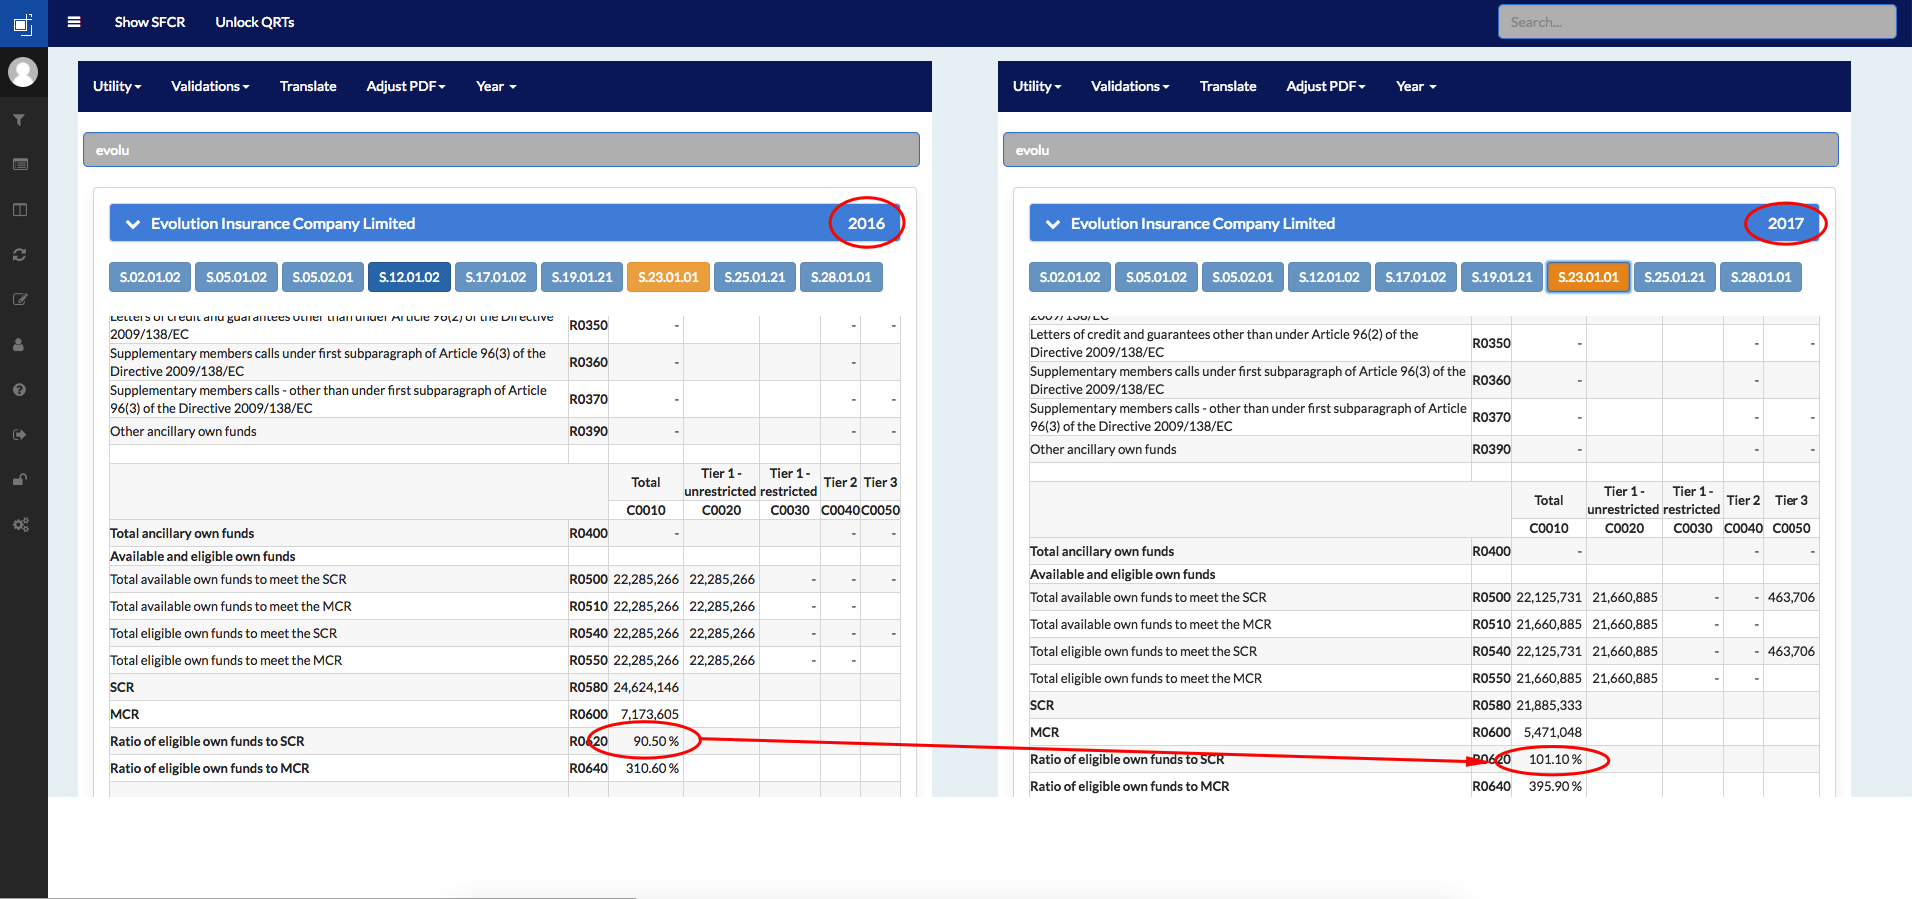
* The SIIW_ID is a unique company number provided and owned by Solvency II Wire Data. It enables accurate tracking of all companies including those that do not have an LEI. The figures show that while the Euroguard ratios decreased slightly in 2017, the ratios for Evolution and Municipal Mutual improved. Evolution has now recovered its SCR ratio to 101.1% (previously 91.5%, see QRT comparison figure) and has exited its Schedule 5 transitional provision, which it used in 2016.
In its SFCR the company states (page 3): “In our previous report, we disclosed that the Company had taken advantage of the transitional provision available under Schedule 5 (paragraph 2(14)) of the Solvency II Act in Gibraltar.
However, in Q1 2017, the directors were delighted to report a solvency surplus to the Gibraltar Financial Services Commission. This was in spite of the change in the personal injury discount rate or ‘Ogden’ rate and the challenges created from the Brexit decision.
While there has been some strengthening in technical provisions in the quarter ended 30 June 2017 in line with the view of the Company’s external reserving actuary, the solvency surplus has been maintained since the Company exited transitional provisions.”
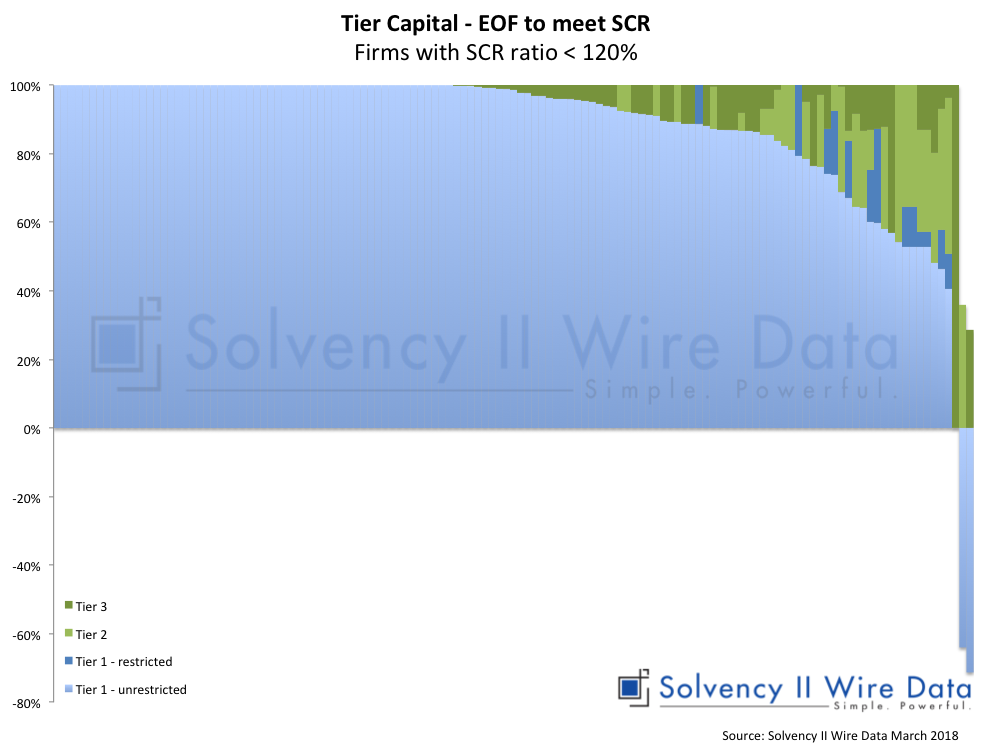
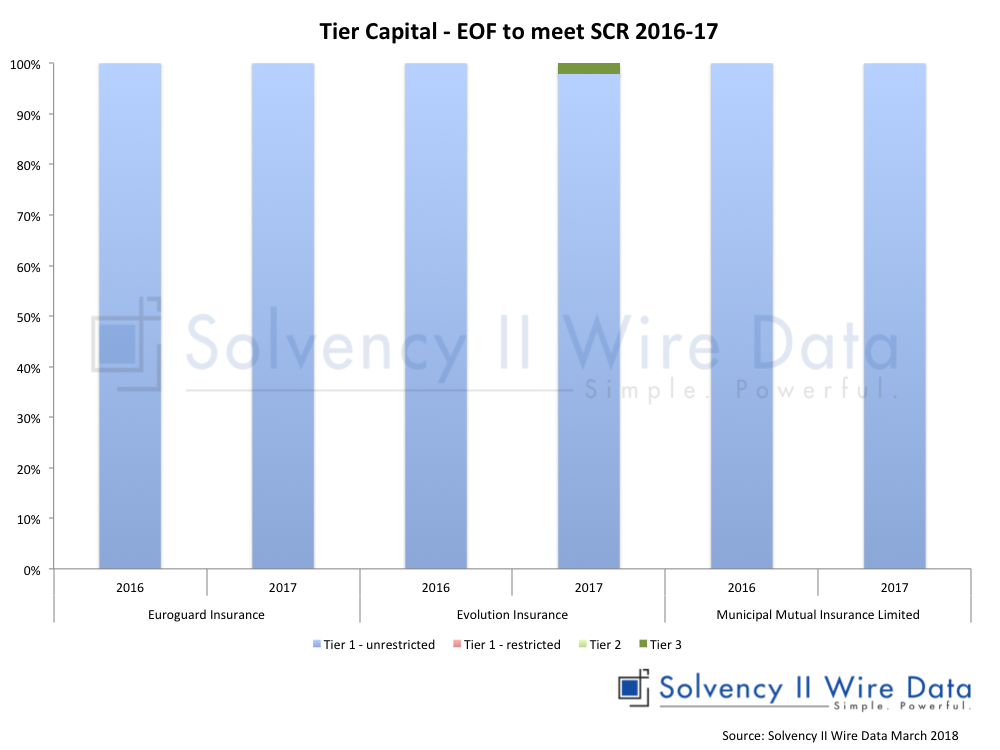
Tier Capital
The majority of firms, with the exception of those firms with a negative SCR ratio, make extensive use of tier 1 unrestricted eligible own funds to cover the SCR.
Figures for the 3 firms with 2017 disclosures show little change in the structure of the tier capital, although Evolution did now have some tier 3 capital.
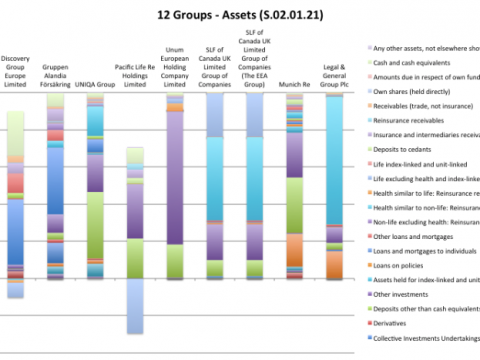
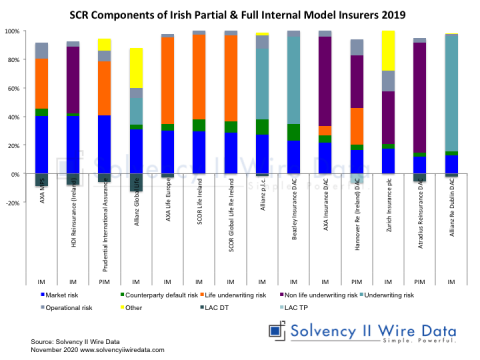
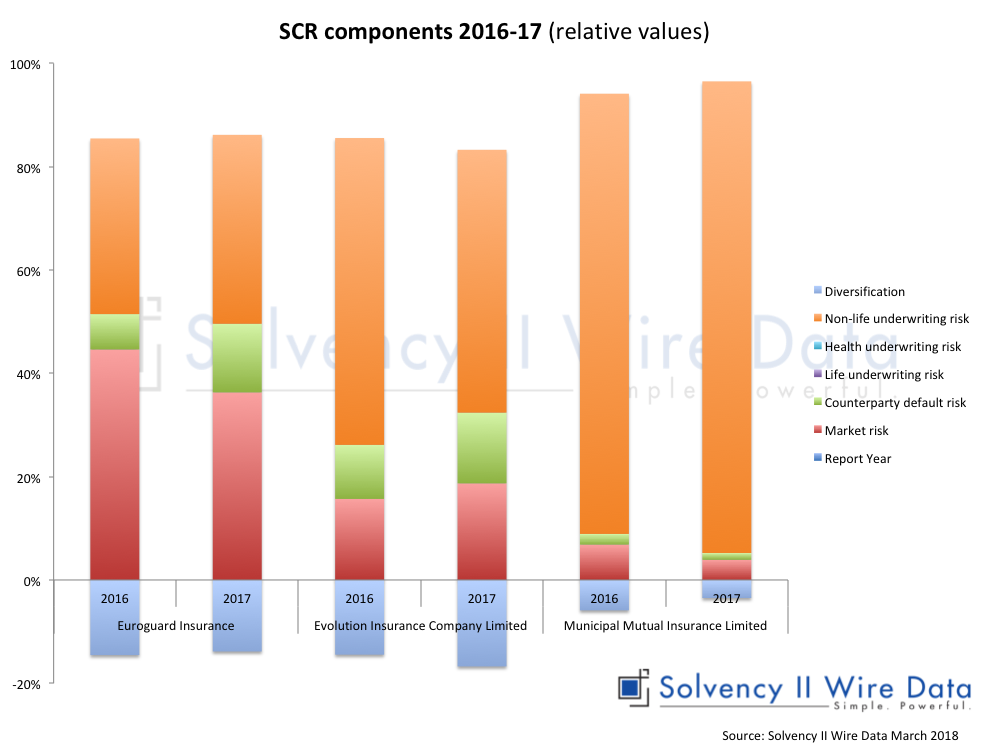
SCR Components
SCR components of the firms are dominated by market risk and non-life underwriting risk. The latter is understandable given the amount of non-life insurers in the sample.
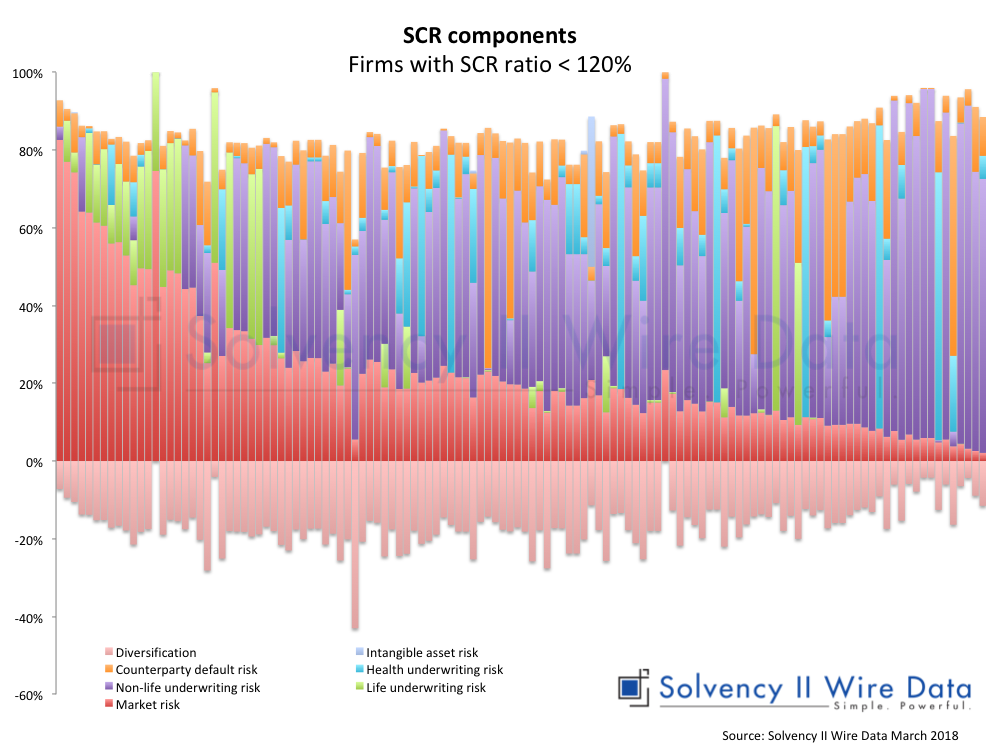
Changes in 2017 show some movement across the SCR risk modules both in absolute and relative terms as illustrated by the two charts below.

Conclusion
The second set of Solvency II public disclosures will be as closely watched as the first, bringing with it further challenges and opportunities for both the European insurance industry and its stakeholders.
—
Full details of individual companies are available to premium subscribers of Solvency II Wire Data.