ANALYSIS
The industry is still at the early stages of making sense of Solvency II figures. This article reviews two alternative ways of using Solvency II for equity valuation.
Solvency II, being a regulatory regime, is concerned with the capital strength of an insurer in order for it to be able to honour its obligations to policyholders. Investors, on the other hand, prioritise the potential to maximise returns on capital in a controlled, risk-adjusted manner. So whilst there are differences in priorities, there is much overlap between a regulator’s interest and a shareholder’s interest. Put another way: for a company to satisfy the regulator it can survive, the regulator should also be interested in its ability to thrive; and for a shareholder to be happy with a company’s ability to thrive, the shareholder should also be interested in its ability to survive. With this alignment of objectives in mind it is interesting to explore how the Solvency II figures can be expressed from a shareholder’s perspective, a question tackled in a research note published this summer by KBW European Insurance (see also here).
Price-to-book valuation in Solvency II terms
Investors in insurance companies are interested in the multiple of capital they are paying for any business (the “price-to-book” multiple). A common benchmark to start with is US GAAP or IFRS capital. Many investors seek to strip out unrealised gains that are deemed to be economically attributable to policyholders and intangibles such as goodwill. This adjusted shareholders’ funds figure can be referred to as Tangible Common Equity (TCE).
The rise and fall of Embedded Value
Historically, some investors have used Embedded Value as an alternative measure of book value, which is preferred because it is believed to be a more marked-to-market measure with attempted consistency of treatment between assets and liabilities. Embedded Value has close similarities with unrestricted tier 1 eligible own funds in the Solvency II regime and so some are looking at this as an evolving useful metric to calibrate current price-to-book multiples. Given that investors are looking at valuation, not solvency, a higher price-to-book multiple implies the need for higher returns or growth to justify the multiple, and vice versa.
Tangible Common Equity based metrics
The authors explore alternatives to price-to-book multiples using Solvency II unrestricted tier 1 eligible own funds versus the current tangible common equity metric. The chart below plots the Solvency II valuation (Price / T1U) on the x-axis against the price / TEC.
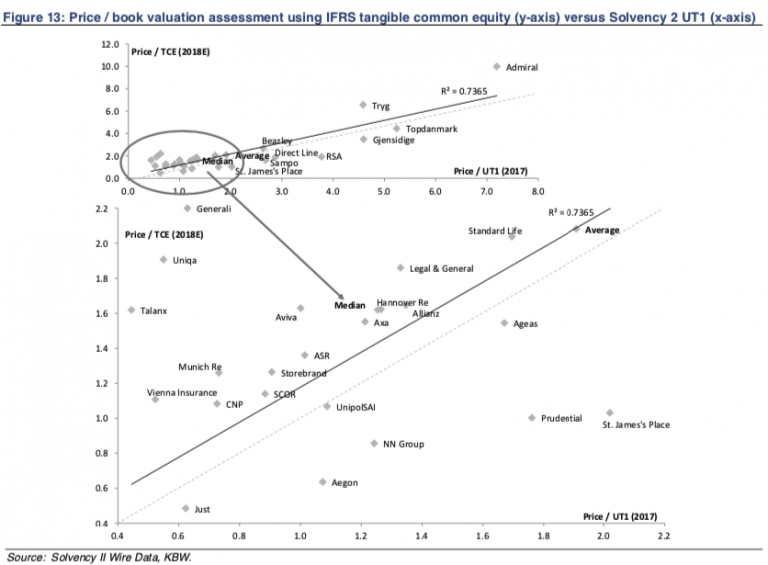
The results show that valuation multiples on a Solvency II basis are on average lower (companies above the line); albeit there are a few outliers. These, the authors note, may be explained in some cases by the exclusion of entities outside of the Solvency II framework (Ageas) or distortions from reliance on US equivalence for US entities (Aegon, Prudential). However, the strong correlation between the two measures would seem to suggest price / T1U may be a useful metric to consider.
IFRS PE multiple
The report also considers another way of applying Solvency II to valuation, one that is based on comparing companies’ Solvency II capital flexibility (UT1 / SCR) to IFRS earnings multiples (P/E ratio).

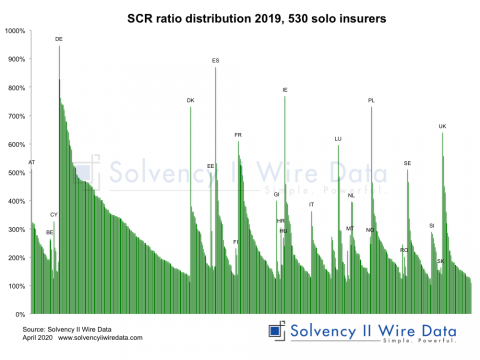
This aims to identify companies with high implied excess capital that could justify premium PE multiples to take account of the surplus. Sticking with this concept, another common measure of capital strength in Solvency II is the SCR ratio excluding any impact of the Long Term Guarantees Measures (LTG).
The chart below plots these against the P/E ratio with the same intention as that for the chart above.
The SCR without LTG measures can be derived from figures in template S.22.01 in the QRTs.
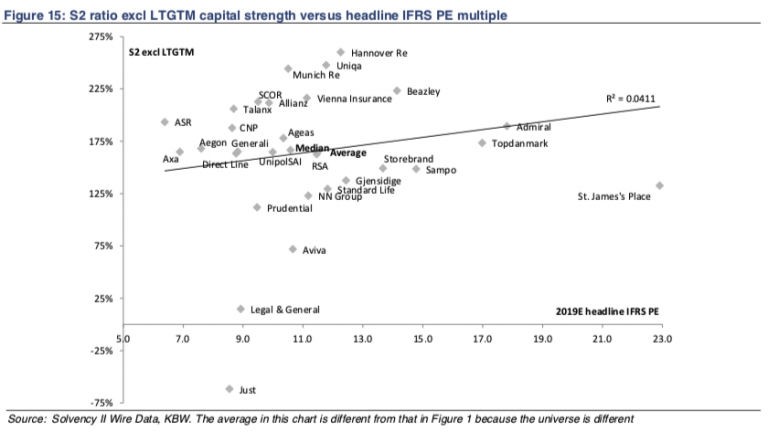
Both charts show an extremely low correlation between excess capital using either measure and IFRS PEs. Given that the principle of the analysis is sound, this tells us either that investors do not accept one of the Solvency II elements or the IFRS PE element. Alternatively, as KBW discusses, it could offer opportunities for the future as investors investigate the anomalies and the correlation rises in the future.
Solvency II: an equity valuation metric?
Solvency II is a regulatory regime and as such considers capital strength and availability primarily from a regulatory perspective. This differs from a more economic or shareholder perspective. However, for listed companies in particular, it is difficult to completely separate the two.
Taking steps that would at least help understand the relationship between these two approaches must surely be a move in the right direction. he deviations in the Solvency II SCR ratios between the headline view and the QRTs will remain.
Over time, users of the data are likely to build these deviations into their analysis and interpretation. The fact that Solvency II provides standardised constants can help to benchmark or calibrate that view and help improve the understanding of insurance companies.
—
Solvency 2: Making use of QRTs is available for KBW’s clients and industry contacts. For further information, please email: whawkins[at]kbw[dot]com.
—
The full set of Solvency II data used for the research is available to Solvency II Wire Data premium subscribers. Find out more here.