Only about 60 of Europe’s largest insurance groups published their Solvency II SFCR and QRTs to date.
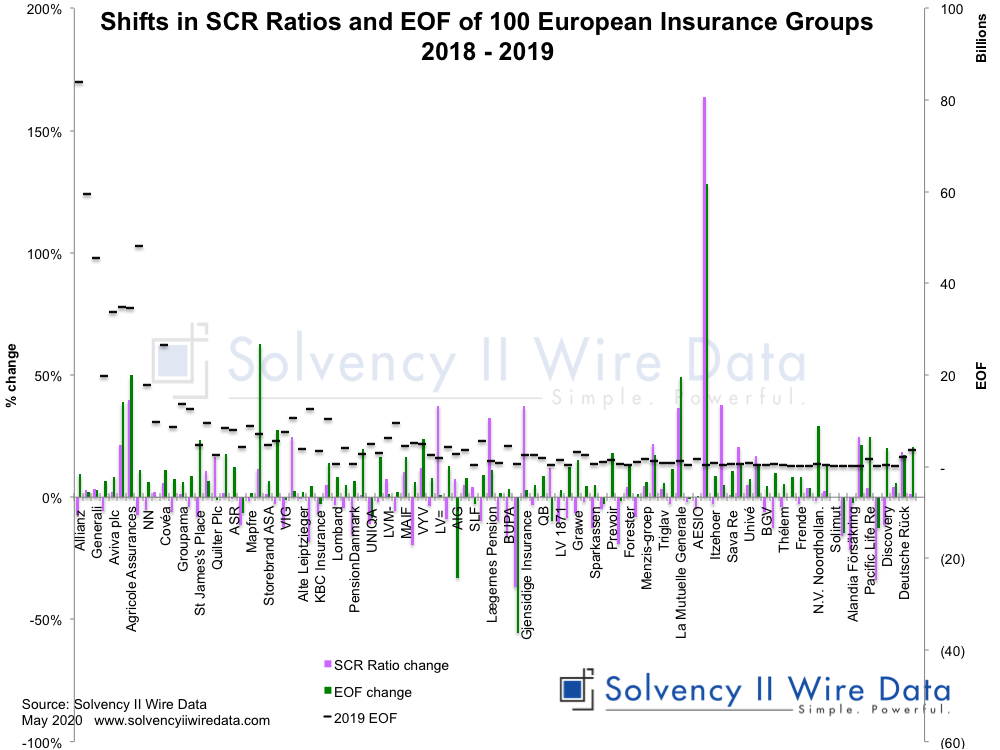
The chart below shows the shift in SCR ratios of the top 100 European insurance groups that have published Solvency II figures to date.
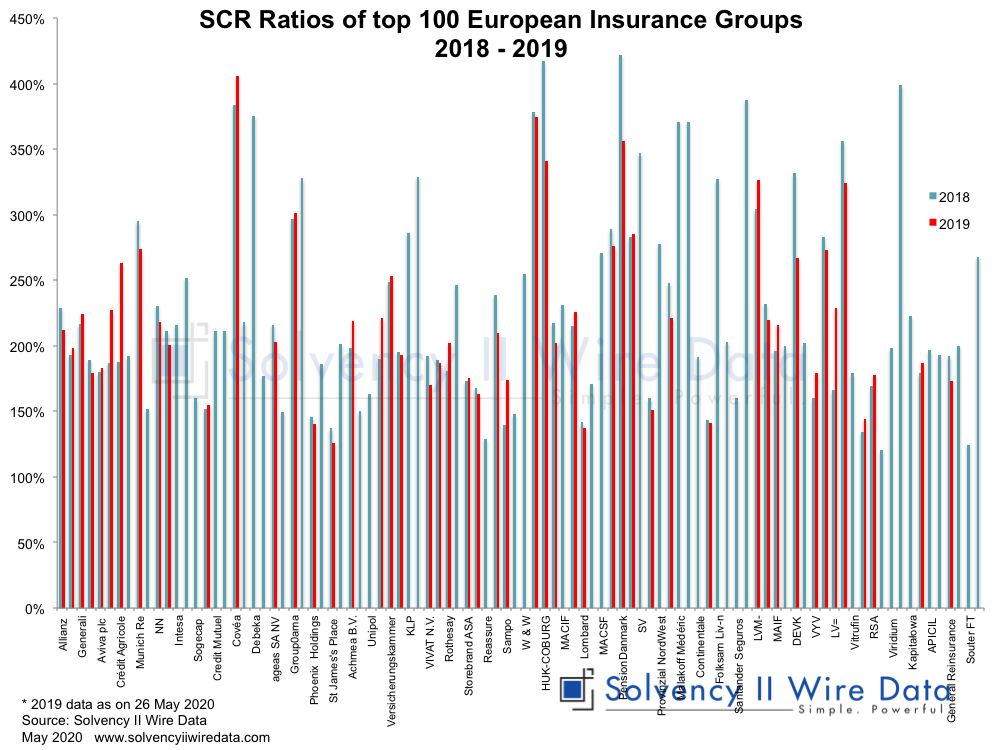
In total about 107 of the c. 300 insurance groups subject to Solvency II reporrting have published their Solvency II disclosures; most of them producing the full set of templates.
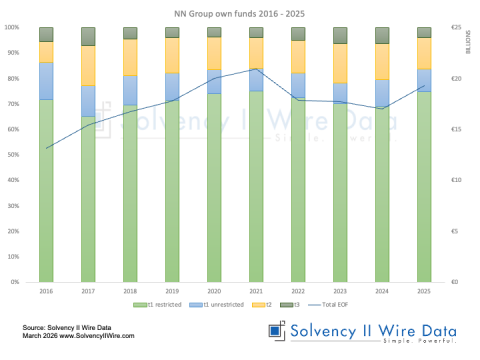
The chart show the percentage change in SCR ratio and Eligible Own Funds (EOF) between 2018-19 (bars left axis). The right axis shows the EOF amount in EUR billion.
Only 3 groups published the four basic templates and a further 3 groups published an SFCR only, without the required templates.
Publication of solo reports continues at a fairly languid pace. To date Solvency II Wire Data has fully about 1,300 solos have published their SFCRs and QRTs. About 120 of these published partial QRTs.
Related Articles:
State of Solvency II reporting 2019 (part 1)
State of Solvency II reporting 2019 (part 2)
State of Solvency II reporting 2019 (part 3)
The number of Solvency II insurance entities in Europe
Solvency II Wire Data collects all available public QRT templates for group and solo.
QRT templates available on Solvency II Wire Data
S.02.01 Balance sheet
S.05.01 Premiums, claims and expenses Life & Non-life
S.05.02 Premiums, claims and expenses by country Life & Non-Life
S.12.01 Life and Health SLT Technical Provisions
S.17.01 Non-life Technical Provisions
S.19.01 Non-life Insurance Claims Information
S.22.01 Impact of long term guarantees and transitional measures
S.23.01 Own funds
S.25.01 SCR Standard formula
S.25.02 SCR Standard Formula Partial Intern Models
S.25.03 SCR Standard Formula Intern Model
S.32.01 Undertakings in the scope of the group