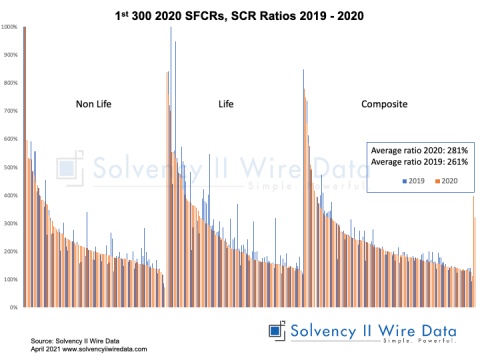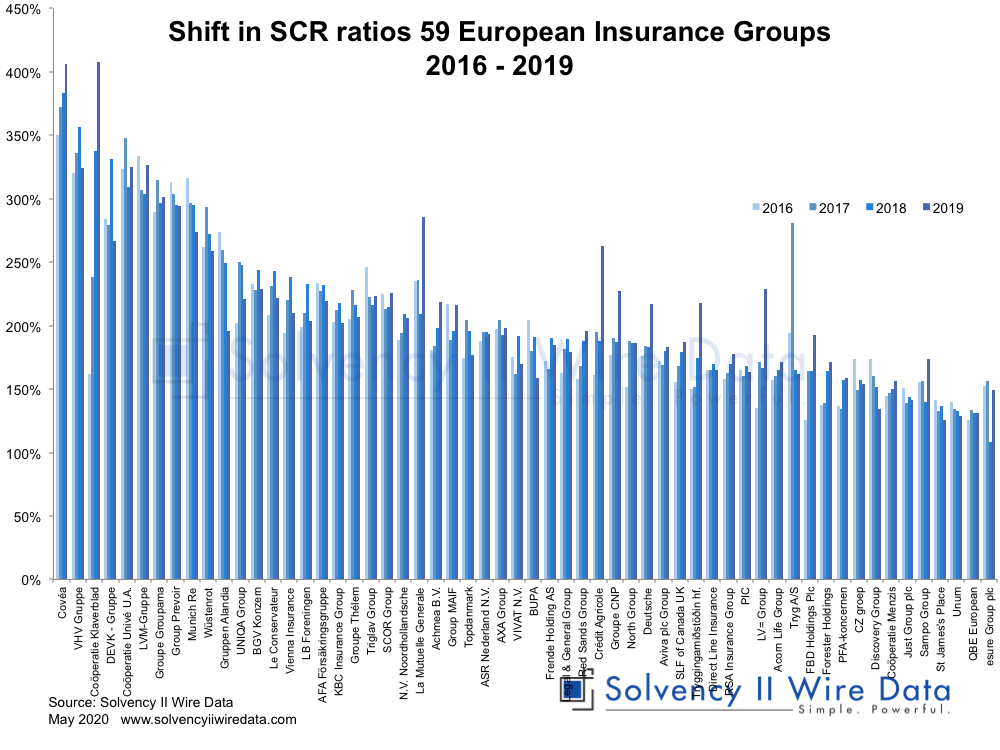
More analysis of SCR ratios of European Insurance Groups
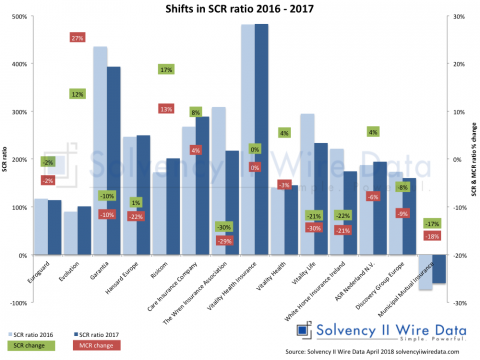
Shifts in SCR and MCR Ratios 2016 – 2020 80 European Insurance Groups
Shift in Eligible Own Funds vs change in SCR Ratio: 95 European insurance groups
Solvency II Wire Data
Shifts in SCR and MCR Ratios 2016 – 2020 80 European Insurance Groups
Shift in Eligible Own Funds vs change in SCR Ratio: 95 European insurance groups