Despite the delays to Solvency II data reporting in 2019 the vast majority of European insurers have now published their SFCR and QRTs.
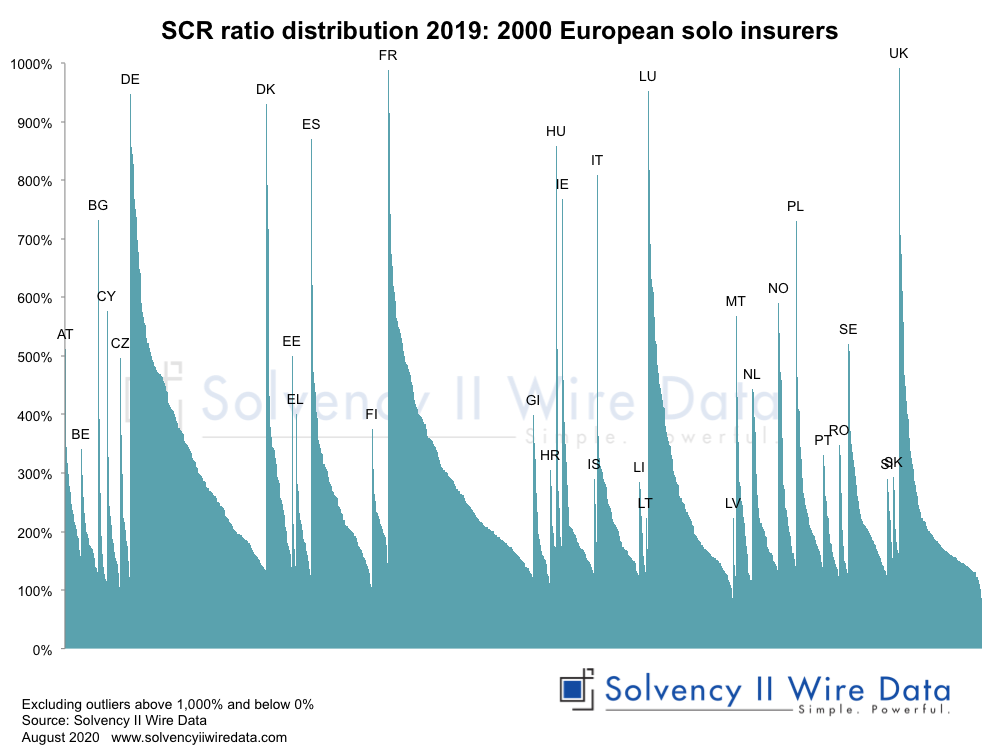
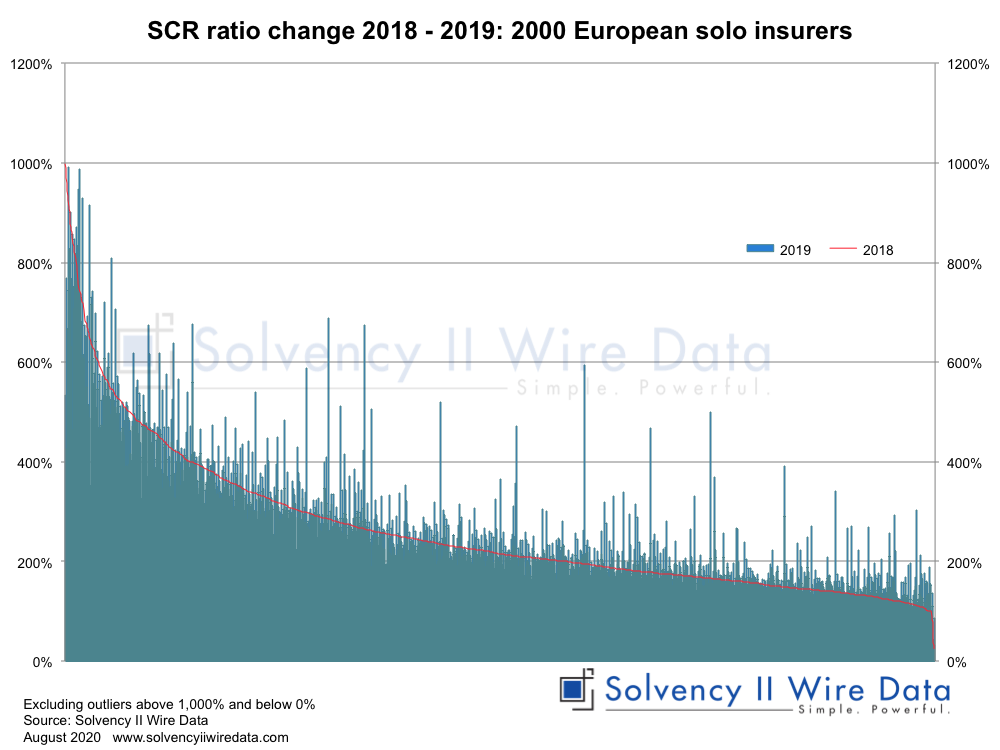
The chart below shows the SCR ratio distribution of c. 2,000 European solo insurers by country.
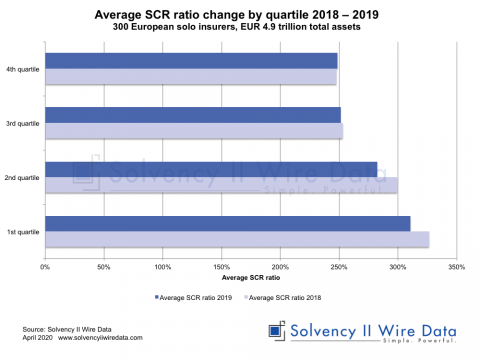
The trend of lower SCR ratios in 2019 for solo insurers, first identified by Solvency II Wire Data in April this year, has persisted.
The chart below shows the 2019 Solvency II ratios compared to last year. The average SCR ratio for the sample in 2019 was 257, compared to 263% in 2018.
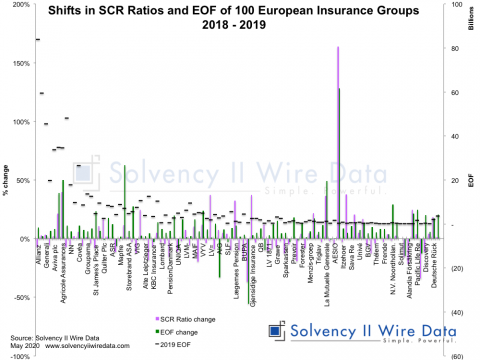
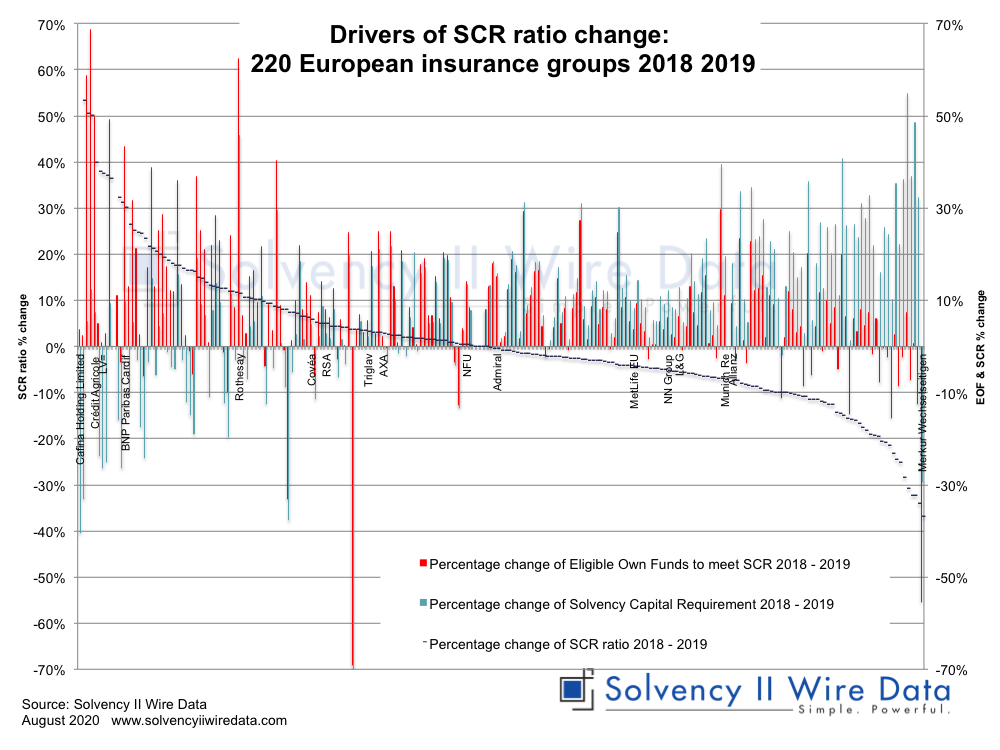
In contrast, analysis of a sample of 220 European insurance groups shows the SCR ratio has increased compared to 2018. The average for the sample rising from 224% to 230%.
The change has been driven by a larger increase in Eligible own Funds realative to a lower increase in the SCR.
State of Solvency II reporting 2019 (part 1)State of Solvency II reporting 2019 (part 1)
State of Solvency II reporting 2019 (part 2)
Solvency II Wire Data collects all available public QRT templates for group and solo.
QRT templates available on Solvency II Wire Data
S.02.01 Balance sheet
S.05.01 Premiums, claims and expenses Life & Non-life
S.05.02 Premiums, claims and expenses by country Life & Non-Life
S.12.01 Life and Health SLT Technical Provisions
S.17.01 Non-life Technical Provisions
S.19.01 Non-life Insurance Claims Information
S.22.01 Impact of long term guarantees and transitional measures
S.23.01 Own funds
S.25.01 SCR Standard formula
S.25.02 SCR Standard Formula Partial Intern Models
S.25.03 SCR Standard Formula Intern Model
S.32.01 Undertakings in the scope of the group