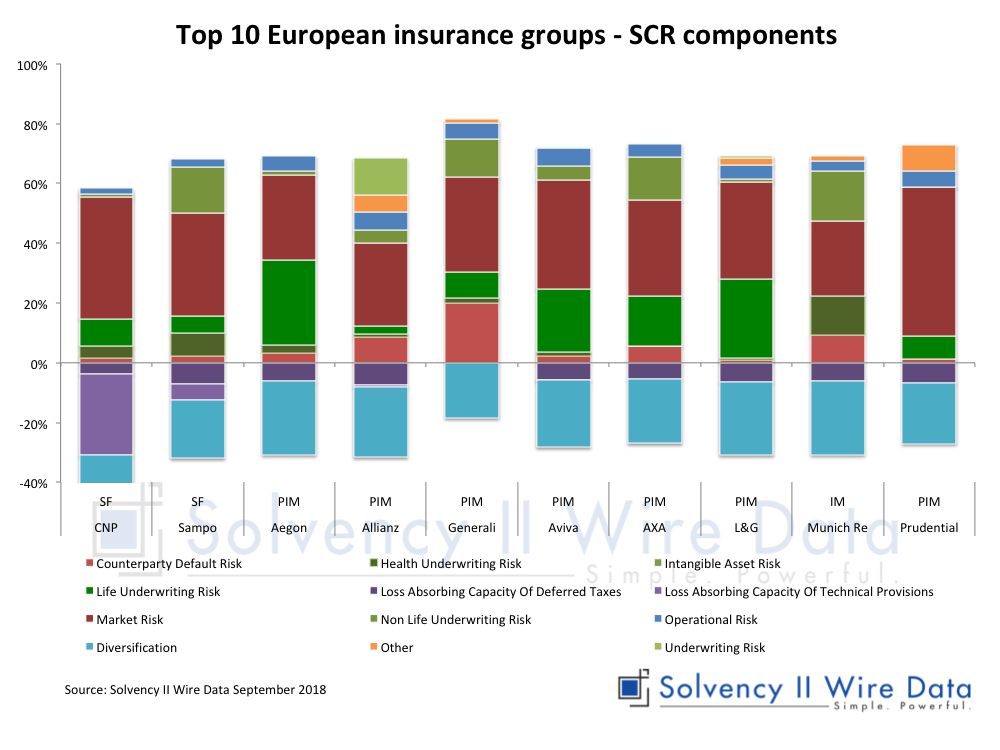
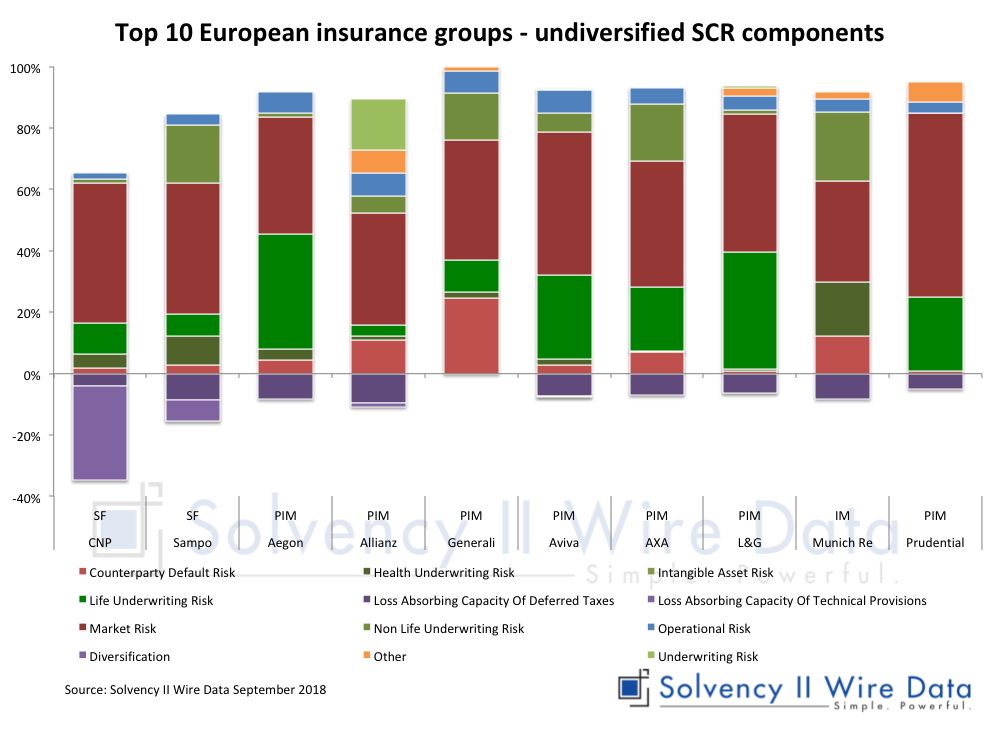
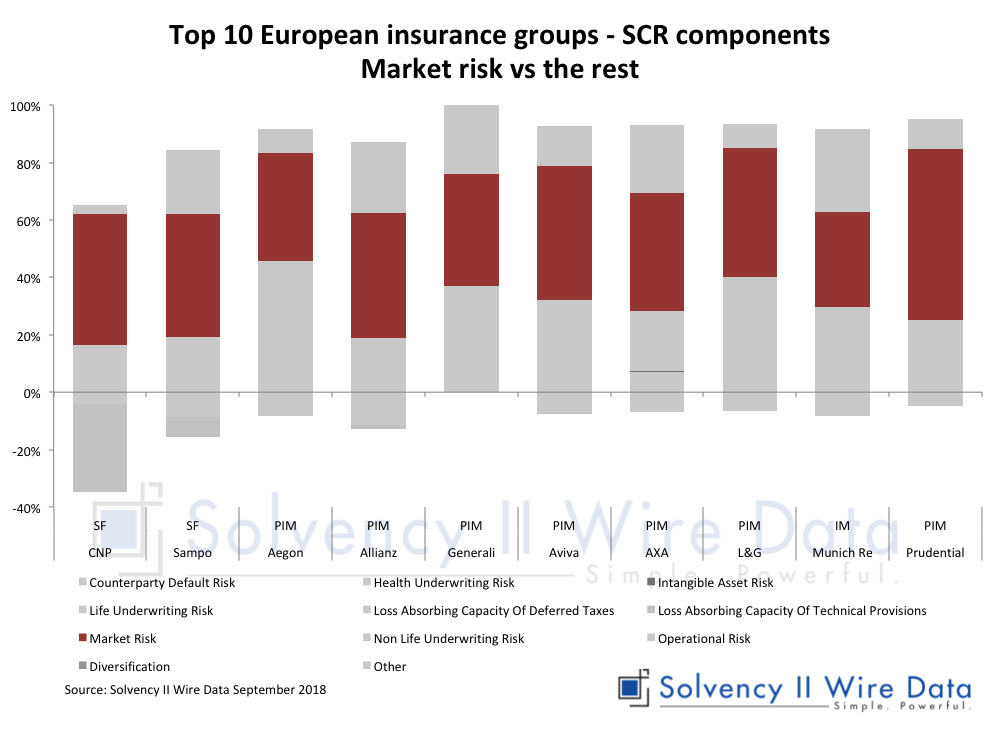
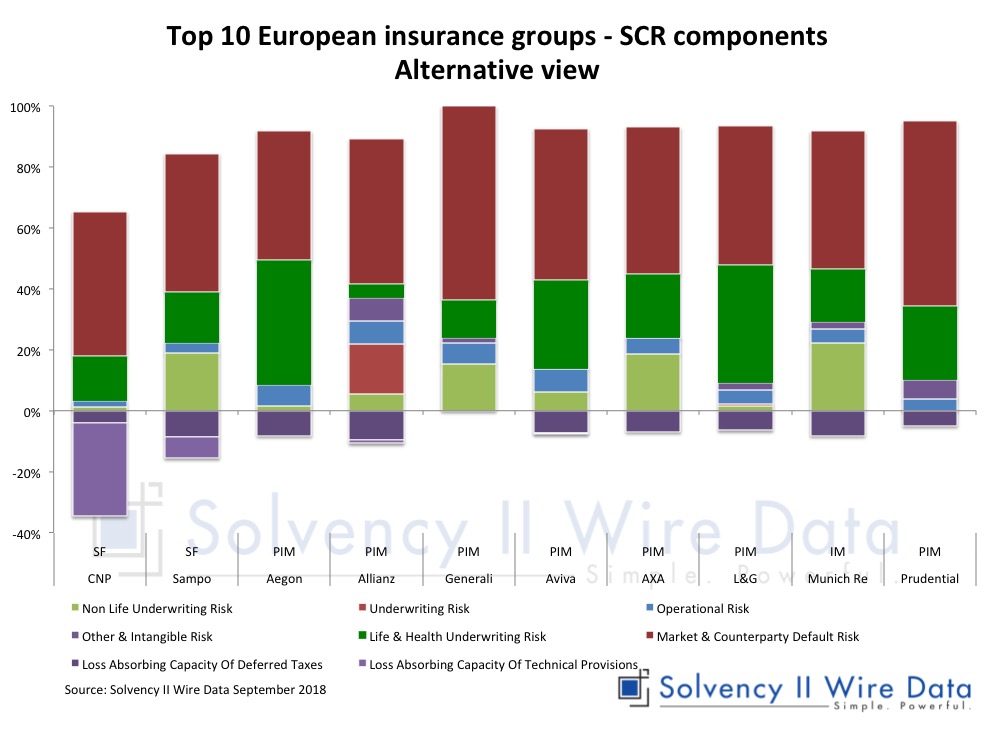
Update on article featuring the Solvency II Wire Data Comparator Tool originally published on September 2018.
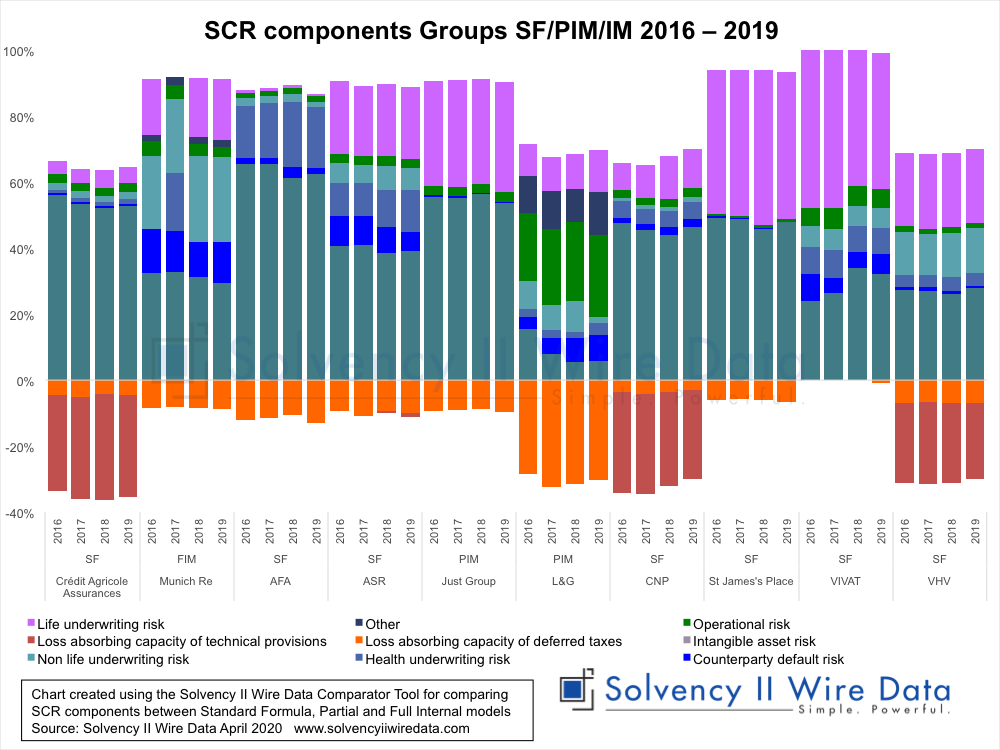
SCR comparison of large European insurance groups
Originally published 11 September 2018.
Solvency II Wire Data
Home » SFCR Analysis » SFCR Archive (2016 - 2019) » Comparing Solvency II SCR components
Update on article featuring the Solvency II Wire Data Comparator Tool originally published on September 2018.

Originally published 11 September 2018.

| M | T | W | T | F | S | S |
|---|---|---|---|---|---|---|
| 1 | 2 | 3 | 4 | 5 | ||
| 6 | 7 | 8 | 9 | 10 | 11 | 12 |
| 13 | 14 | 15 | 16 | 17 | 18 | 19 |
| 20 | 21 | 22 | 23 | 24 | 25 | 26 |
| 27 | 28 | 29 | 30 | 31 | ||
analysis asset allocation Basel III Bermuda Climate risk Comment counter-cyclical premium Data EIOPA eligible own funds Equivalence European Commission European Parliament Extrapolation FSA Groups Illiquidity Premium implementation Insurance Europe Interim measures Internal model Investment Level 2 LTG Matching adjustment Omnibus II ORSA Pillar I Pillar II Pillar III QRTs Regulation Reporting SCR SCR ratio SFCR SFCR 2023 SFCR 2024 Solvency II solvency UK standard formula Stress test tier capital timeline trilogue
Copyright © 2026 Solvency II Wire