ANALYSIS
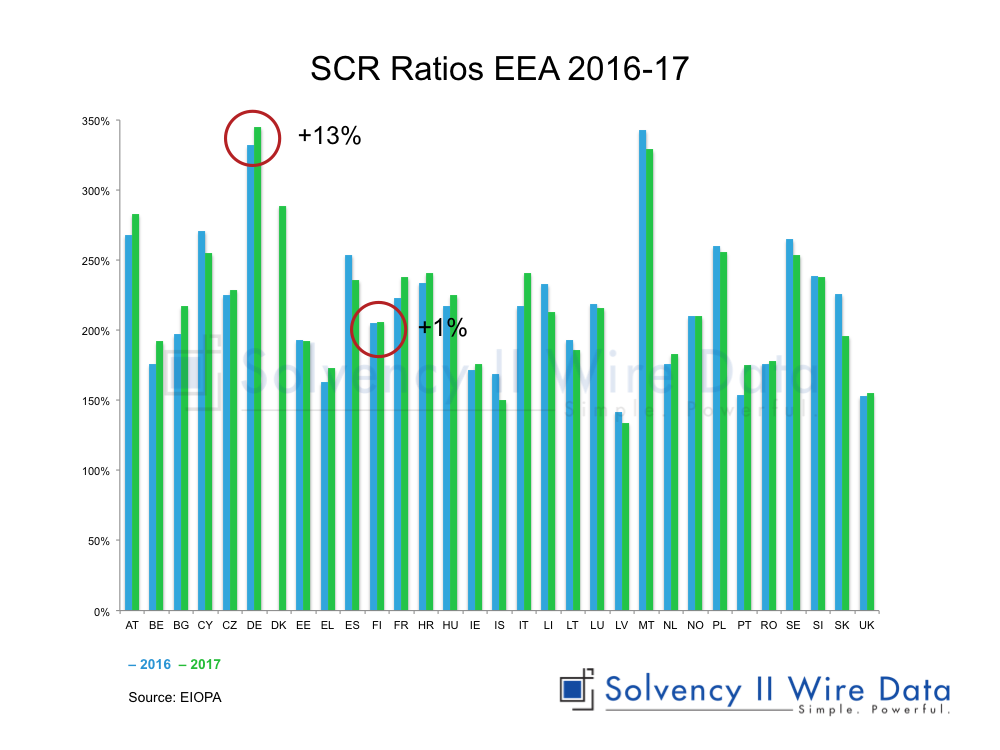
In November EIOPA published the second set of annual Solvency II statistics. The figures show that the SCR ratio for the EEA has increased from 229% to 239% between 2016 and 2017. The increase was mostly driven by a much bigger rise in the Eligible own funds to meet the SCR (from EUR 1.5 billion to 1.6 billion) compared with a more moderate increase in the SCR itself (EUR 0.661 billion to EUR 0.674 billion).
Total assets increased from EUR 11.1 trillion to EUR 11.74 trillion and non-life Gross Written Premium (GWP) increased from EUR 445.7 billion to EUR 469 billion. The chart below shows that the overall increase in the SCR ratio masks variations between countries across the EEA.
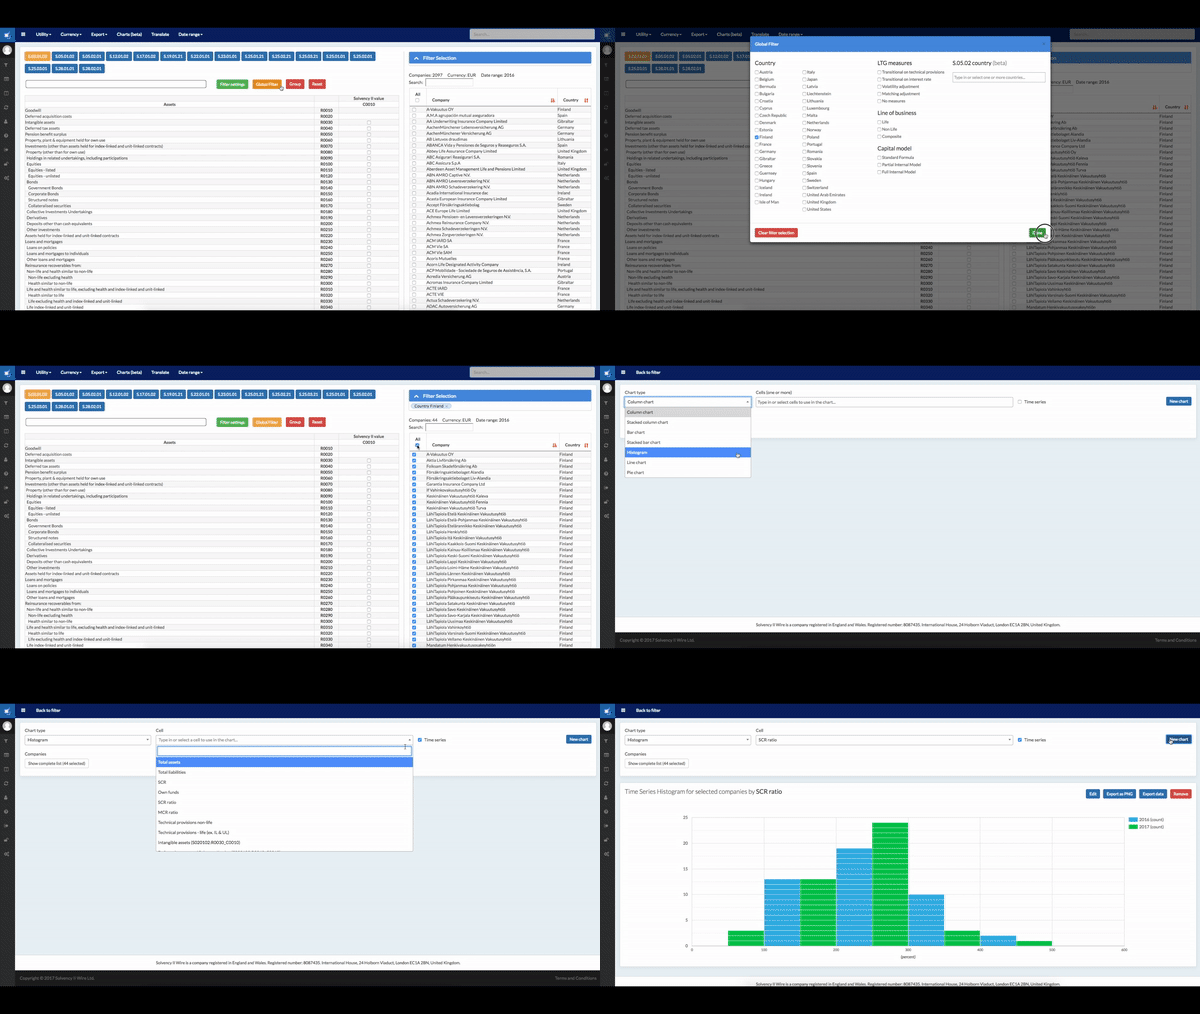
Using the Solvency II Wire Data histogram charting tool it is possible to analyse these changes at a company level and attain a much more nuanced understanding of the drivers shaping the change in the Solvency II SCR ratios.
Deep-dive into the Solvency II SCR Ratios in Germany and Finland
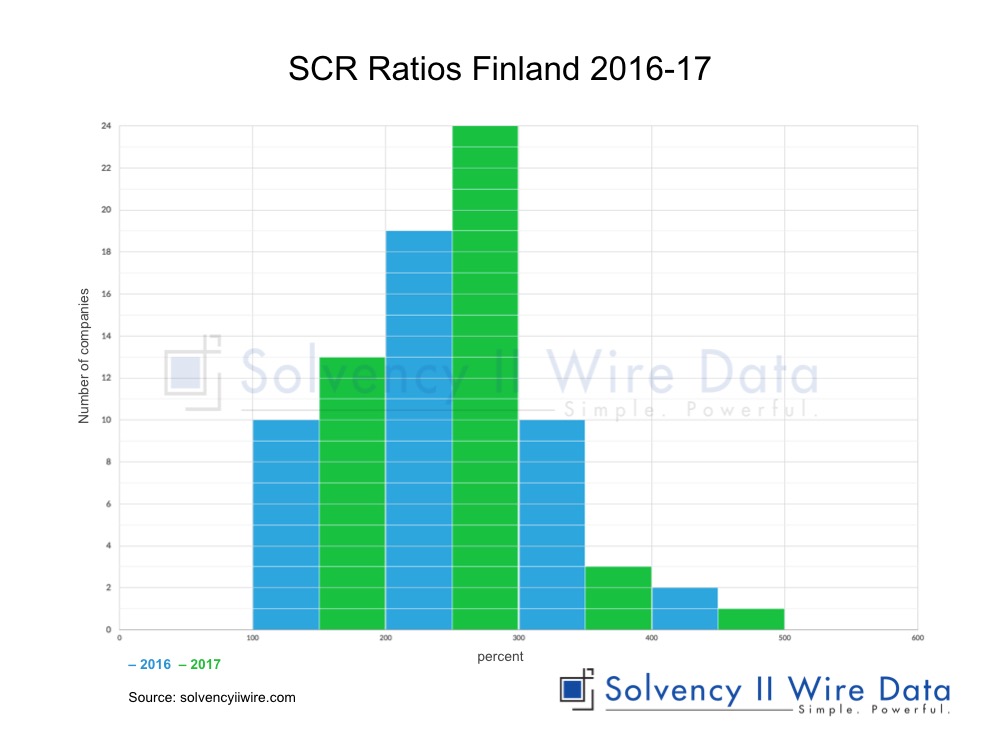
Germany, for example exhibited an increase in SCR ratio from 332% in 2016 to 345% the following year. The histogram below shows the drivers of the change. There was a decrease in the number of companies that had ratios in the lower bands (100%-199% and 200%-299%), while the increase in the number of companies in some of the upper bands (400%, 500% and particularly 700%) also help to drive up the national average. In Finland, on the other hand, the SCR ratio remained stable (205% in 2016 and 206% in 2017). However, the histogram shows significant shifts in the ratio across he market.
There were increases in the number of companies populating the lower two bands, which have been offset by a reduction in the population of the two upper bands (300% and 400% respectively) pointing to a concentration of the ratios across the Finnish market.
The two histograms also give an indication of the distribution of the ratios in each country. In Germany there is wide distribution of the 305 companies used in the sample ranging between 100% and 1,100%. However in Finland the range for 42 companies is much narrower ranging between 100% and 500%.
Changes in the Solvency II MCR ratio across Europe
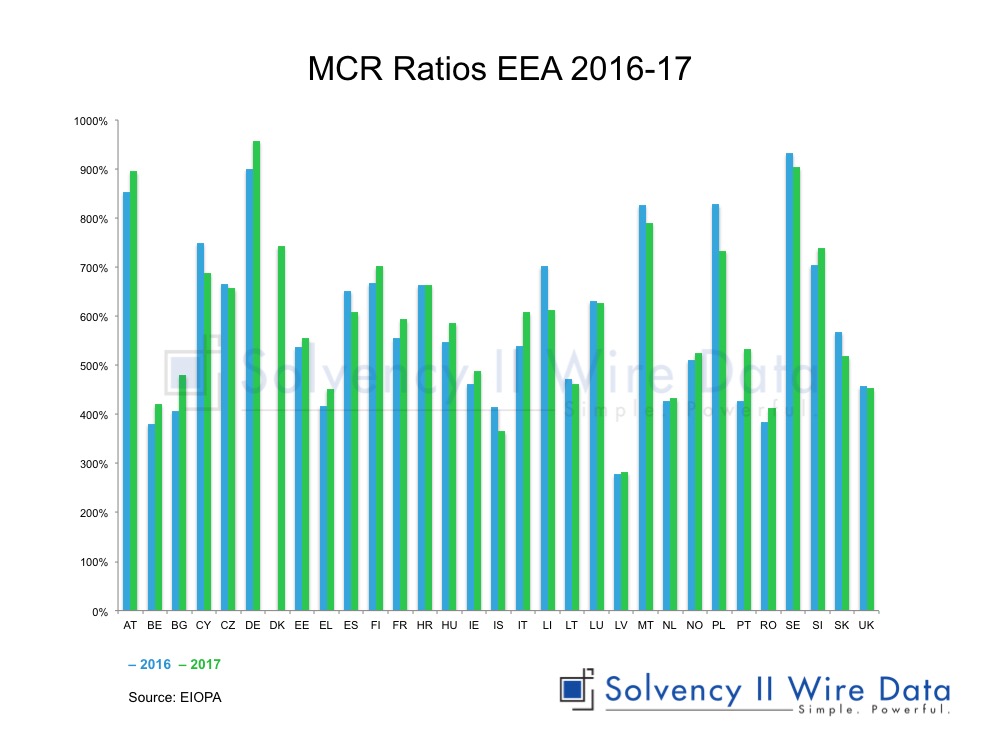
Similar variances are notable in respect of the MCR ratios in both countries. The average MCR ratio for the EEA was 648%, up from 618% the previous year.
In Germany, where the average MCR ratio was 958% in 2017, compared to 900% in 2016 (see charts below), there was a much wider distribution of ratios. These range from 100% up to 4,000%, with the bulk of companies concentrated in the bands below 2,000%.
For most bands below 900% there has been a population decrease in 2017 suggesting an overall strengthening of the capital position.
However, it is notable that there are still a substantial number of companies that have an MCR ratio of 100% and 200%. The MCR is the lower of the two capital ratios, which, if breached, will force the company to stop trading.
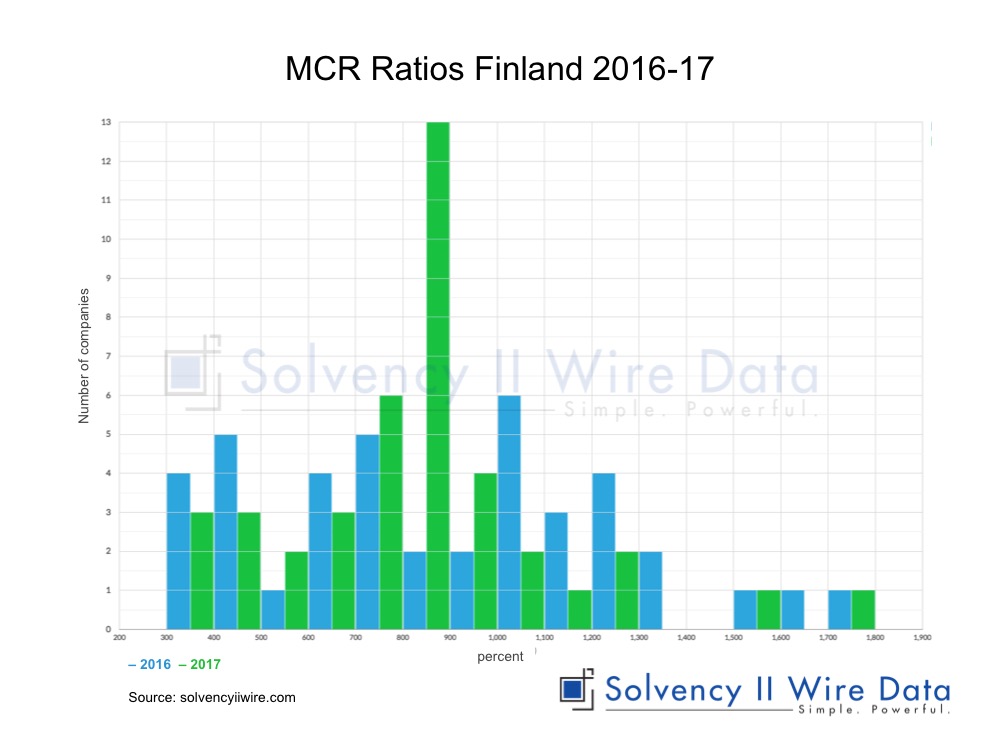
In Finland (see charts below) the MCR ratio has shifted from 668% up to 702% in 2017. The histogram reveals that the lower band of MCR ratios is 300%. It also shows a decrease in most bands and a concentration in the 800% band, further supporting the hypothesis that the market is converging.
The analysis shows that the average Solvency II SCR ratio figures mask differences within countries and can reveal underlying weaknesses that may be masked by positive average figures.
The full set of Solvency II data used for the research is available to Solvency II Wire Data premium subscribers.
Creating histograms on Solvency II Wire Data
