The Solvency II public disclosures have been held up as an essential mechanism for enforcing market discipline on the European insurance industry.
Solvency II Wire and LCP have teamed up to investigate some of the first insurance failures under Solvency II in order to assess the value and quality of the Solvency II public disclosures.
Part 1 of the article, A cross-border reinsurance spiral, uncovers some of the limitations of the narrative public disclosures. Part 2 leverages the Quantitative Reporting Templates (QRTs), to build a set of metrics that could help identify potential weaknesses in capital structure.
Authors:
 Gideon Benari Editor, Solvency II Wire Gideon Benari Editor, Solvency II Wire |  James Sandow Associate consultant, LCP James Sandow Associate consultant, LCP |
Disclaimer: the events described in this article are on-going. Information is accurate, based on our understanding of the available data as at date of publication.
Part 2: Putting the Solvency II QRTs to the test

Extensive risk transfer took place using various reinsurance arrangements that enabled the New Zealand based CBL Insurance (CBLI) – which was effectively the CBL Group’s reinsurance entity – to gain exposure to a large book of French construction insurance. The exposure was gained via three European solo entities: Alpha Insurance A/S (Alpha) in Denmark, CBL Insurance Europe DAC (CBLIE) in Ireland and Elite Insurance Company Limited (Elite) in Gibraltar. Although quota share reinsurance was the main method of risk transfer, each company had a slightly different arrangement.
Following the collapse of Alpha, court documents revealed that it had a quota share reinsurance arrangement with CBLI in respect of about 50% of the French construction insurance business it wrote. These arrangements were in place throughout the period in question. However, for Elite and CBLIE the arrangements changed over time.
A distinction needs to be made between two separate periods: before the transfer of the business from the Gibraltar based entity (Elite) to the Irish based entity (CBLIE) at the end of 2016, and after the transfer. Before the transfer Elite ceded about 80% of the risk of the French construction business to CBLI using quota share reinsurance. After the transfer CBLIE used a quota share arrangement to cede 90% of that business to CBLI.
CBLI then used a retrocession arrangement to cede about 22% of its share back to Elite. As a result, after the transfer CBLIE held 10% of the risk directly, Elite held 20% of the risk and CBLI 70%. The final phase of the arrangement was after Elite entered run off, at which point the retrocession ceased, and the risk remained within the CBL group, 10% with CBLIE and the remaining 90% with CBLI (see table below).
Following the reinsurance trail
Given the significance of reinsurance in the risk transfers that led to the collapse of the group and associated European companies, it follows that reinsurance could serve as the basis for analysis and an attempt to build a set of KPIs that would identify future potential weaknesses.
The publicly disclosed Solvency II Quantitative Reporting Templates (QRTs) do not include a line directly asking insurers how insured they are. However, it is possible to calculate proxies for this using the data from the reports.
Given that this analysis should be focused on the interaction between reinsurance and insolvency these metrics should help to understand how reinsured a company is, as well as what impact this might have on its capital requirement.
Proxy 1: How reinsured are you?
One way of answering the first question is to look at the ratio of reinsurance technical provisions (RI-TP, template S.17.01.02 – Non-Life Technical Provisions, cell R0330_C0180) to gross technical provisions (TP, template S.17.01.02 – Non-Life Technical Provisions – cell R0260_C0180).
This should be a reasonable measure of how reinsured a company is, because it gives an indication of the amount of reinsurance used, relative to all of the business written by the company. Generally speaking, the higher the ratio the more reinsured a company is, i.e. the more reinsurance cover it has taken out.
Proxy 2: The impact of reinsurance on capital
The impact of the amount of reinsurance on a company’s capital requirements could be estimated using the level of counterparty default risk in its Solvency Capital Requirement. The ratio of counterpart default risk (CPDR, template S.25.01.21 – SCR, Standard Formula, cell R0020_C0110) to the SCR (template S.25.01.21 – SCR, Standard Formula, cell R0100_C0110) can, therefore, be used as a proxy for this measure.
All other things being equal, a company that purchases more reinsurance should have a higher counterparty default risk (both in absolute terms, and as a proportion of their SCR).
Building reinsurance KPIs
There are approximately 3000 solo insurance companies in Europe subject to Solvency II. To provide more relevant analysis, the sample is narrowed down to match the profile of the three European entities more closely.
The full dataset from Solvency II Wire Data was filtered as follows: non-life and composite Solo insurers that use the Standard Formula to calculate their SCR; and are regulated in the UK, Denmark, Ireland or Gibraltar. The sample is also limited to the first reporting year (ordinarily YE 31 December 2016).
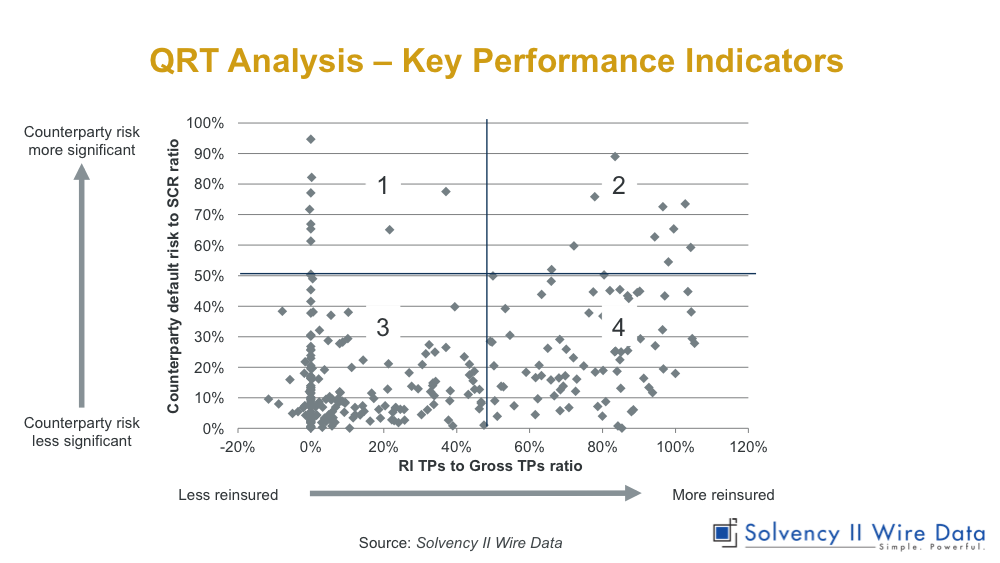
This reduces the sample to around 300 companies. Using these two metrics, RI-TP to TP and CPDR to SCR it is possible to plot the sample on a two-axis chart (below).
The four quadrants of the chart each represent a different relationship between how reinsured a company is and how that is reflected in their capital requirement The lower left quadrant (3) represents companies with low levels of reinsurance and a low level of counterparty default risk relative to the SCR. This is reasonable to expect given that reinsurance represents a counterparty default risk.
The top right quadrant (2) represents the opposite position i.e. companies with high reinsurance and high counterparty default risk, which is reasonable to expect for the same reasons.
The top left quadrant (1) represents companies with low levels of reinsurance but with high counterparty default risk. Whilst initially perhaps unexpected, this is not unreasonable given there are a range of other potential sources of counterparty risk aside from expected reinsurance recoveries (e.g. if a company had large deposits with other third parties).
The lower right quadrant (4) represents companies with high reinsurance, but with only a small CPDR/SCR ratio i.e. counterparty default risk is of relatively little significance to their capital requirement. Although there may be reasonable explanations for being in this area, these might warrant further investigation.
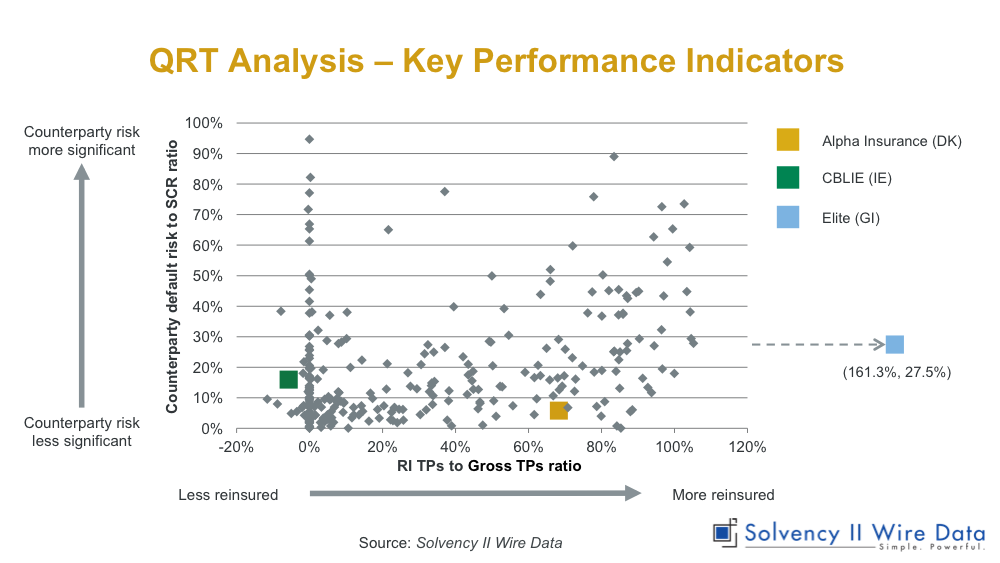
Broadly speaking, the further to the right companies are, the higher up they are (as expected). In other words, it would be expected that the more reinsured a company is, the more significant the CPDR would be to their capital requirement. Somewhat surprisingly the three solo entities appear in three very different locations on the chart.
Elite
Elite is an outlier on the lower right. This is because the reinsurance recoverable of GBP 172m is materially higher than the gross best estimate technical provisions of GBP 106m. That is, Elite’s balance sheet assumed that the future cash in-flows in respect of reinsurance recoveries (net of premiums payable) would be materially higher than the future cash out-flows in respect of the claims themselves (net of premiums receivable).
Despite this, the counterparty default risk capital of £12m is relatively small when compared with the overall SCR of £43m. The SFCR does not mention this somewhat unusual situation. Solvency II Wire has emailed to Elite to request an explanation. However, at the time of publication the company had not yet responded.
CBLIE
CBLIE is also located in an unexpected section of the chart given its high levels of reinsurance. In fact, court documents suggest that at any given time CBLIE had quota share reinsurance with CBLI in New Zealand, representing approximately between 70%-90% of its GWP.
However, the RI-TP to TP metric for CBLIE is skewed by the fact that its RI-TP is negative. This typically occurs when a firm expects to pay more out in reinsurance premiums than it expects to receive in recoveries.
Alpha
The core of the analysis focuses on Alpha, however, as it has the largest number of companies clustered around it. Alpha is located in the lower right quadrant (4), which has been highlighted as being of potential interest, where CPDR seems disproportionately small given their level of reinsurance.
To put Alpha is some context, and to better understand why companies might be in this area of the chart first required looking at companies in its immediate vicinity – doing so reveals a few emerging patterns.
The importance of total assets & SCR
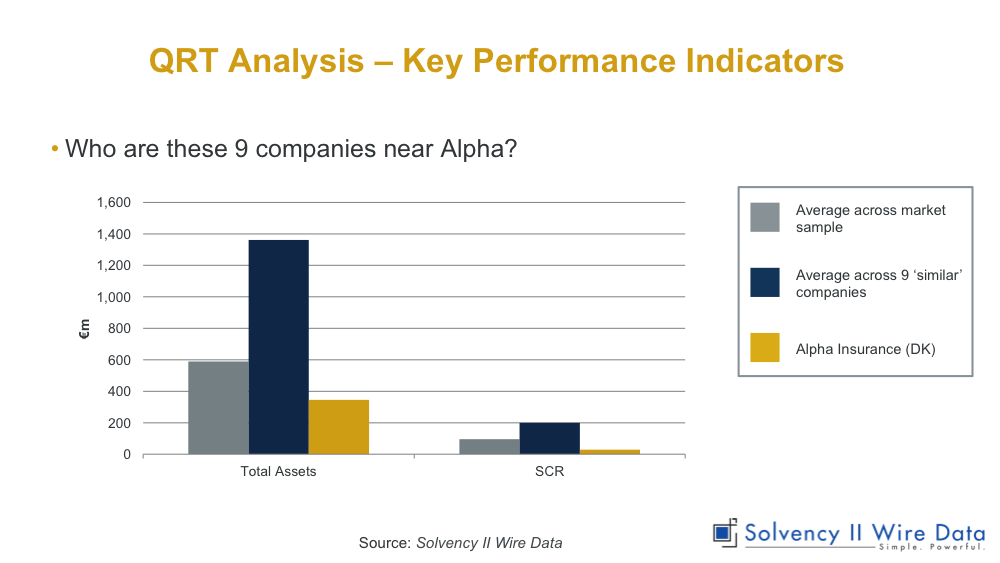
The companies are generally very large, with Total Assets (S.02.01.02 – Balance Sheet, cell R0500_C0010) average of around EUR 1.4bn compared to the average across our sample of EUR 0.6bn; and average SCR value of EUR 200m compared to sample average of EUR 95m.
Belonging to a large group
A number of these nine companies are part of very large international (re)insurance companies, e.g. Berkshire Hathaway International Insurance, Chubb Europe, RSA Insurance Ireland and SCOR UK Company Ltd. This is perhaps the most plausible explanation as to why they are in this part of the chart as they often have substantial intra-group reinsurance arrangements.
A review of the SFCRs of these companies confirms the existence of such arrangements. For example, the RSA Insurance Ireland 2016 SFCR show that the company has significant quota share reinsurance and adverse development cover in place, as well as provision of EUR 90m of Tier 2 capital.
While the Berkshire Hathaway International Insurance Limited 2016 SFCR states that they rely heavily on their parent – NICO (which has assets over USD 200bn) – for reinsurance. Their SFCR reveals an extensive reinsurance programme including a quota share arrangement, followed by event excess of loss cover, followed by whole account stop loss. In addition, the SFCRs reveal that many of these large companies use strategies to reduce their counterparty default risk.
For example, the SCOR UK Company Ltd 2016 SFCR states that the company employs “a trust fund arrangement supporting the exposure of its most material intra-group reinsurance contract.”
Berkshire Hathaway, on the other hand, rely on their parent reinsurer’s ‘superior’ credit rating and “certain collateral arrangements” to manage credit risk. The affiliation to large reinsurance groups and the myriad of arrangements these companies have in place explain why they are located in this part of the charts. However, it is not clear that Alpha fits into this mould.
Alpha an outlier
Alpha does have a significant quota share reinsurance arrangements like its peers, but it is not part of a large reinsurance group. It is also substantially smaller than the benchmark group. Not only does it have total assets and SCR smaller than the benchmark, but also below the average across the full sample.
Reinsurance KPIs in detail
Another approach to comparing Alpha and its nine peers is by using a wider range of KPIs. Rather than comparing two metrics on a scatter chart, it is possible build a profile for a company by looking at multiple KPIs at once. These metrics might include:
- RI TPs / Gross TPs (the x-axis of the previous 2-axis chart)
- Counterparty default risk / SCR (the y-axis of the previous 2-axis chart)
- Reinsurance assets RI assets / Total assets
- Reinsurance premiums / Gross premiums (written)
- Technical provisions ratio / CPDR Ratio (the ratio of the first two metrics)
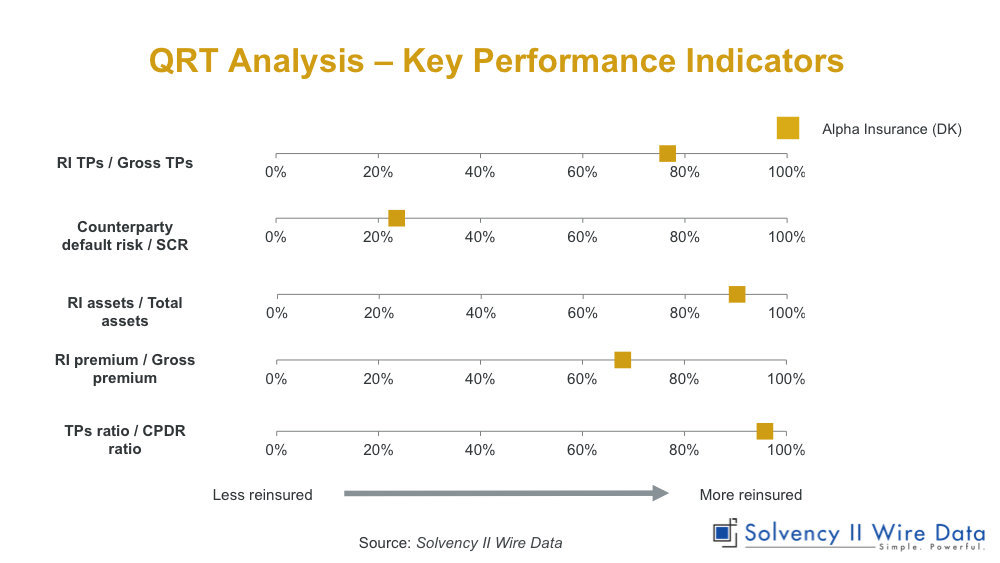
To make it easier to compare companies, these are converted to percentiles across the sample, as represented in the chart below. On this chart, the 50th percentile is the median value for that measure across our sample, i.e. the value of the RI-TPs to TP ratio for which half of the sample companies are above and half are below.
Given that these metrics are all, to some extent, measures of the same concept, i.e. level of reinsurance, it is expected that each company will be located at roughly the same percentile across all these measures. In this example it is striking that Alpha is in the upper percentiles for most KPIs, but in a much lower percentile for the KPI looking at reinsurance level from a capital perspective.
The data can also be plotted on a spider diagram (below) for better comparison across the benchmark group.
The chart shows the position of Alpha relative to the 50thpercentile (median) of the peer group. The view confirms that the company is very heavily reinsured with relatively small CPDR. Plotting the data for the rest of the benchmark group reveals that on two metrics, Reinsurance premium / Gross premium and CPDR/SCR they diverge significantly. The reason this appears particularly anomalous is that these two measures suggest that, despite having a material amount of reinsurance in place, Alpha is paying proportionately less for this cover (low reinsurance premium / gross premium metric) and is having to hold relatively less capital to protect against what appears to be a sizeable counterparty default risk (low CPDR/SCR metric).
Putting the Solvency II QRTs to the test
The charts and KPIs are helpful for identifying benchmark groups and then identifying any potential outliers within them. However, it was not merely the data that revealed that there was one company in this group that didn’t quite fit in, it was background market knowledge, and further details provided in SFCRs that truly revealed a contrast between a group of very large international companies, and Alpha.
The attempt to use the Solvency II QRT data to build a set of metrics that would identify potential weaknesses in the capital position of insurance companies has been instructive. On the one hand it has shown the advantages of having a harmonised dataset that could be harnessed to identify target companies. However, at the same time it has also demonstrated some of the limitations of the data, especially when trying to interpret the data in detail.
The research also highlighted that the Solvency II public disclosures cannot be viewed in isolation and are only part of the overall picture of the financial health of companies and markets.
Lessons from the CBL story
Sifting through the wreckage of insurance failure, or at least examining the corpora of a number of badly bruised firms, has provided fertile ground for the examination of the Solvency II public disclosures.
First, it demonstrates that any large shifts in key metrics, whether it is growth or increasing reinsurance exposures still serves as a useful warning sign. In this it validates some of the original thinking that underlies Solvency II. And more specifically the findings of the Sharma report, that advocates early intervention to mitigate failure.
Given the scope of the case, affecting companies in Europe and New Zealand, it has also inadvertently shed light on the limitations of Solvency II for dealing with risks arising from jurisdictions outside the scope of the regime. In the current climate of rising nationalism and unilateral withdrawal from multilateral treaties, is this case the canary in the mine?
Foretelling of the potential dangers of an ever-growing international financial system breaking through an already barely adequate shield of global international regulation. It was also clear from the research that the Solvency II public disclosures cannot be viewed in isolation. Without a heavy dose of hindsight and detailed company and court documents it would have been impossible to tell the story in such detail and detect the potential trouble ahead.
On that count the Solvency II public disclosures could be deemed to have failed or at least bitterly disappoint anyone who was hoping they would provide a silver bullet for understanding the structures and financials of insurance firms.
But it is also true to say that for anyone watching these companies closely and having an intimate knowledge of the market (as many analysts would of their market segment and insurers would of their competitors) much of what has been uncovered would not come as a surprise.In that sense this two part investigation has revealed that that the Solvency II public disclosures are to a large extent in the eye of the beholder.

