2018 SFCRs and QRTs, the Solvency II public disclosures for the year ending 31 December 2018, were officially published on 22 April. In practice several companies published before the weekend, which allowed for earlier than expected analysis of emerging market trends.
The following analysis is based on the SFCRs of about 300 solo entities and 18 groups collected and fully processed by Solvency II Wire Data.
The sample covers about EUR 4.8 trillion total assets and EUR 450 billion Eligible Own Funds to meet the SCR.
While it includes most of the large solo insurance entities in Europe there are a number of notable absentees, including: Allianz SFCR 2018, Just Retirement SFCR 2018 and Liverpool Victoria, for example. These and several others have an exemption to publish a single group SFCR that will include the solo QRTs. Officially they are due to be published on 3 June 2018, but it is likely some will publish earlier.
SCR ratios 2018
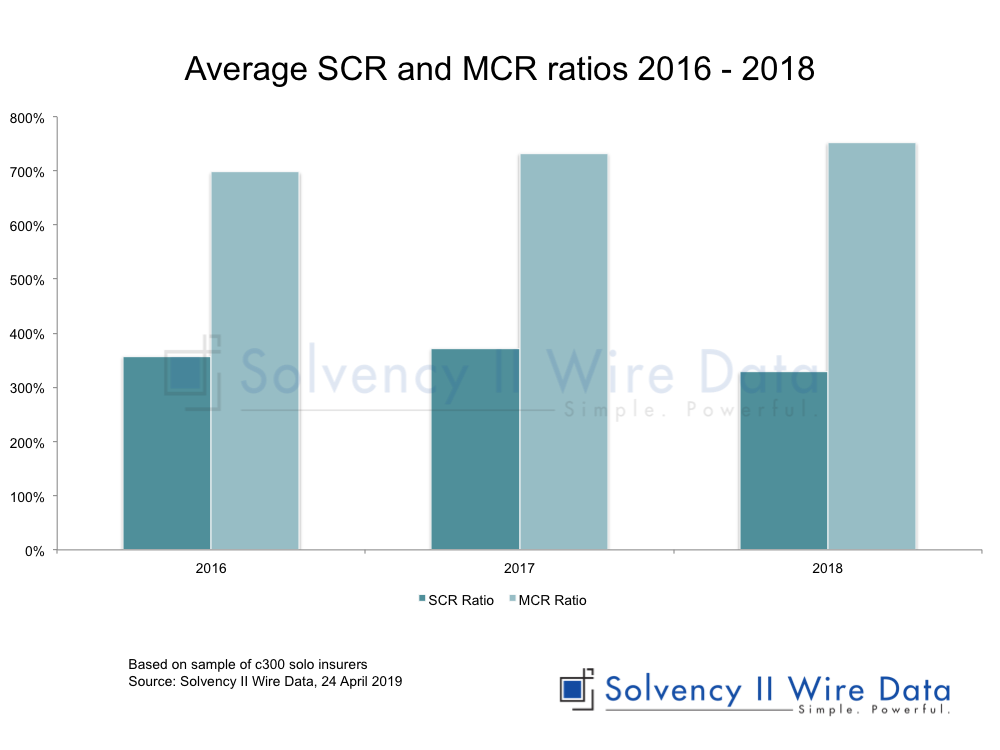
The average SCR ratio for the sample is 329% and the average MCR ratio is 752%.
As can be seen from the chart there is a steady increase in the MCR ratio over the period 2016 – 2018, but there was a decline in average SCR ratio of the sample.
The sample split by line of business is as follows: 110 life , 105 non life, 86 composite.
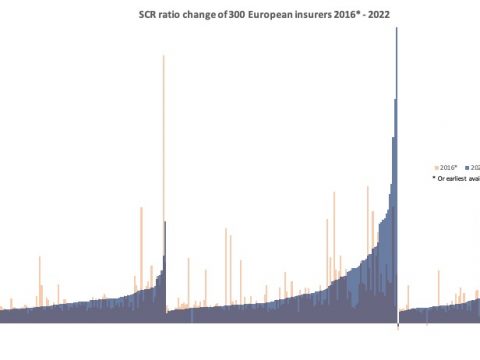
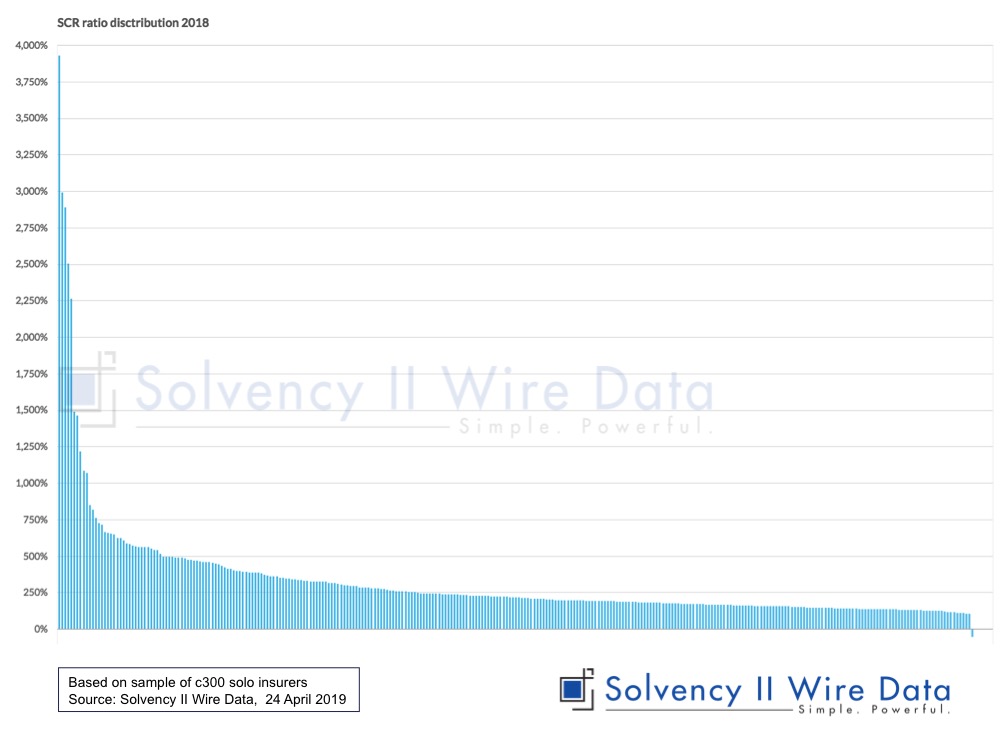
The chart below shows the 2018 distribution of SCR ratios.
Shifts in Solvency II Own Funds 2016 – 2018
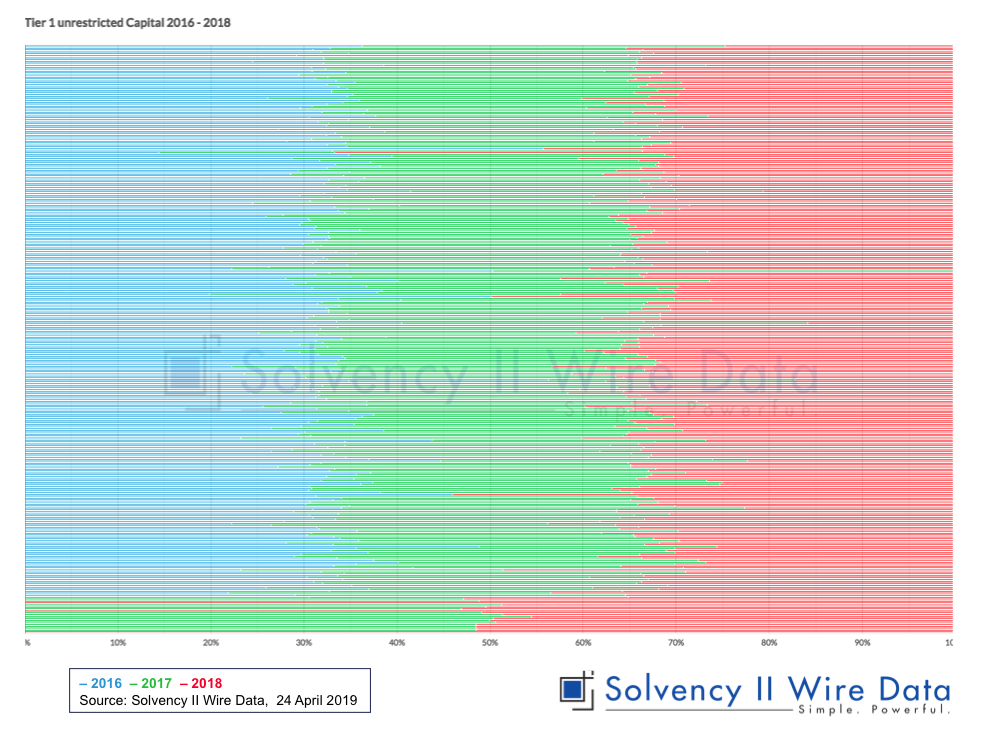
As expected, the distribution of the EUR 450 billion Eligible Own Funds to meet the SCR of the sample is heavily slanted towards Tier 1 unrestricted capital (see two chart below).
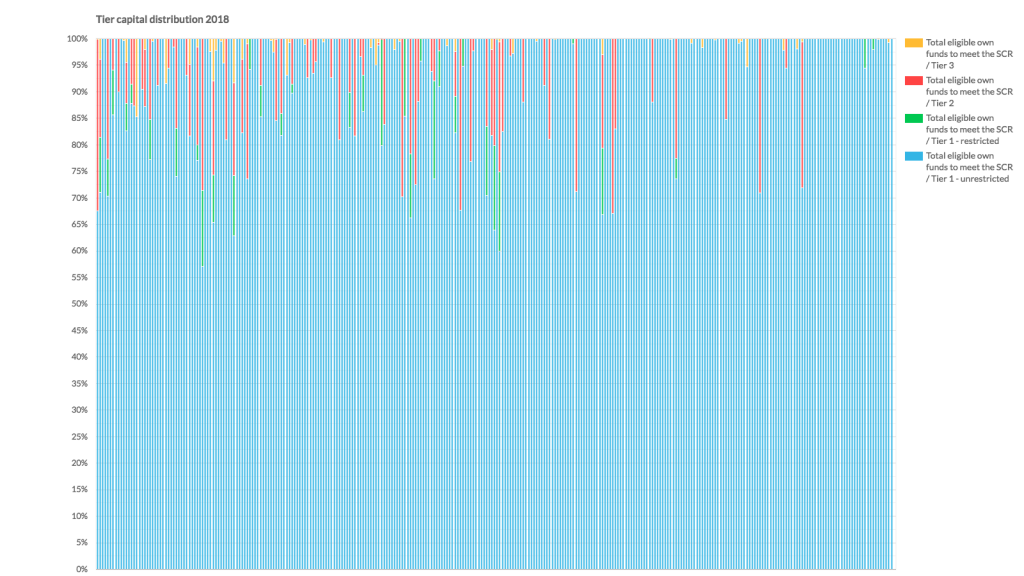
Closer inspection reveals how the distribution of Tier 1 unrestricted own funds has shifted over the period.
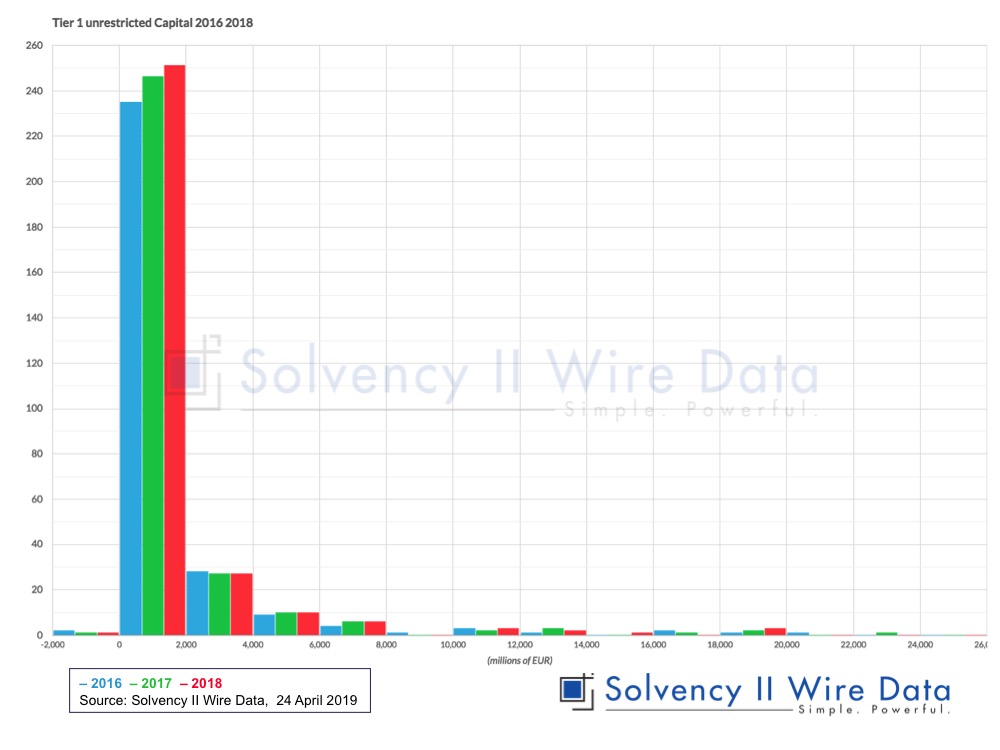
The histogram below shows that the distribution of Tier 1 unrestricted capital shifted steadily over the period with more firms occupying the lower range in 2018. This may suggests that over the period firms have reduced their allocation towards the lower capital tiers, to make more efficient use of their capital.
The analysis provided here is a snapshot based on an early sample and while giving an incomplete picture of the market, it may prove a useful early indicator given the size of companies included. Additional data, will over time, show if these trend holds true for the mid-size and smaller insurers.
Our Solvency II Wire Data database gives you unparalleled access to the Solvency II public disclosures.
Click here to find out more details or request a demo.