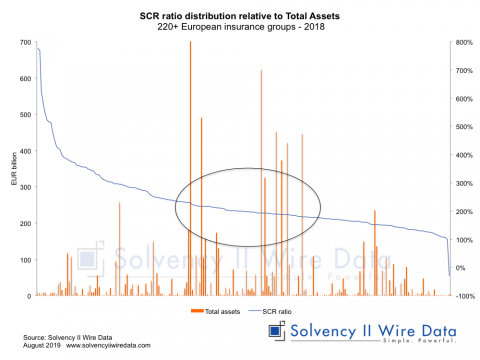
Analysis of Total Assets distribution relative to solvency ratios of European insurance groups – 2018

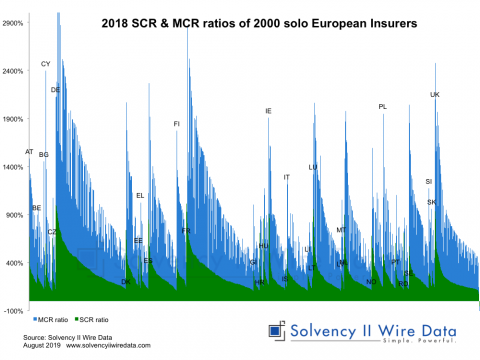
2018 Solvency II ratios (SCR ratio and MCR ratio) distribution of 2000 European solo insurers.

Third Solvency II Survey reveals resilience of UK and Irish non-life insurers as Brexit concerns mount

3rd Solvency II Survey reveals resilience of UK and Irish non-life insurers as Brexit concerns mount

SFCRs 2018 – a market snapshot from early collection

Trends in Solvency II ratio distributions

Solvency II News: 1st large European insurance group published 2018 SFCR

Solvency II News: first 2018 SFCRs

Solvency II News: first 2018 SFCRs

A deep-dive into the Solvency II SCR ratios

Putting the Solvency II QRTs to the test

A cross-border reinsurance spiral

Solvency II and equity price valuation

Tracking shifts in counterparty default risk

Tracking shifts in counterparty default risk

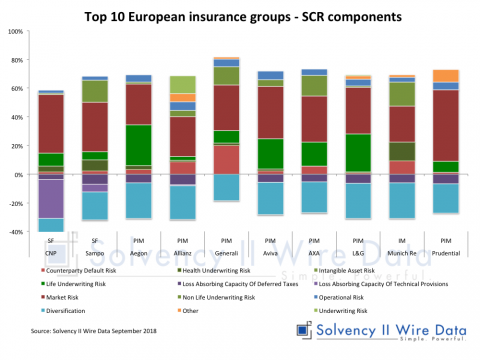
SCR components comparison of European insurance groups

Shareholder view’ biggest driver of deviation from QRT Solvency II ratio

‘Shareholder view’ biggest driver of deviation from QRT Solvency II ratio

Experimental financial statistics for UK insurance sector using Solvency II data

Experimental financial statistics for UK insurance sector using Solvency II data

Model change impacts on the solvency of European insurers

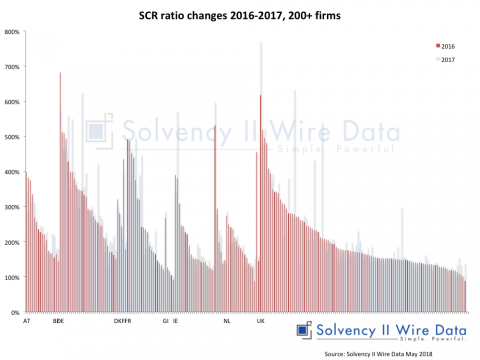
The average ratio for the sample (which excludes outliers above 10,000% and below 0%) was 247% in 2017 compared to 258% in 2017

Solvency II Wire News: SCR ratio analysis of over half of the European Solvency II market

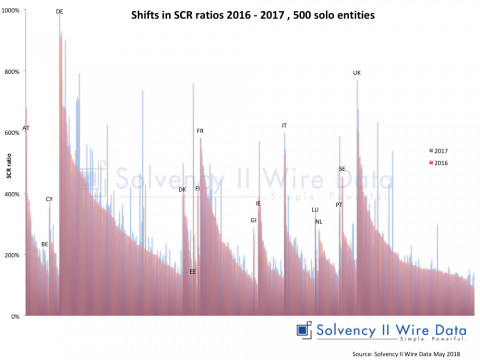
Shifts in SCR ratios 2016-2017

Shifts in SCR ratios 2016-2017, 200+ European insurers

Insurance groups early publication of Solvency II disclosures

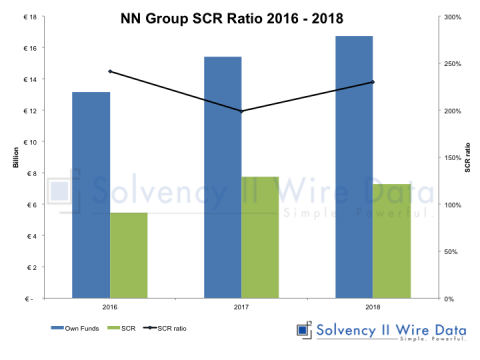
Dutch insurance groups and other insurers publish first Solvency II SFCRs and QRTs 2017

Dutch insurance groups and other insurers publish first Solvency II SFCRs and QRTs 2017