ANALYSIS
Much has been made of the comparability of the Solvency II figures between firms using the Standard Formula and those using an Internal Model or Partial Internal Model. This article explores the topic by comparing the structure of the Solvency Capital Requirement (SCR) components of ten of the largest European insurance groups.
The core of the SCR calculation in the Standard Formula (SF) is made up of 7 predefined components (e.g. Market Risk, Life Underwriting Risk, etc.) that are reported in template S.25.01 of the QRTs. The challenge in making the comparison with Internal Model (IM) and Partial Internal Model (PIM) firms is that the latter two can define their own SCR components to best reflect their model and risk profile.
The sample reviewed here includes two SF firms (CNP and Sampo), 7 PIM firms (Aegon, Allianz, Generali, Aviva, AXA, L&G & Prudential) and one firm using a full internal model (Munich Re). Collectively the firms in the sample reported 129 individual components between them.
However, the distribution is uneven. The Standard Formula firms reported 9 components each – the 7 standard formula items in template S.25.01 as well as ‘Loss-absorbing capacity of technical provisions’ (LAC-TC) and ‘Loss-absorbing capacity of deferred taxes’ (LAC-DT). Of the Partial Internal Model firms, Legal & General reported 34 components, Allianz, Aegon and Aviva reported 15, 11 and 10 components respectively and the rest used 7 or 8. The Internal Model firm, Munich Re, reported 7 components.
In order to compare the firms we use the Solvency II Wire Data Internal Model Comparator tool, which helps to aggregate the individual SCR components of Internal and Partial Internal Model firms to the Standard Formula categories.
An all-in view of the SCR components
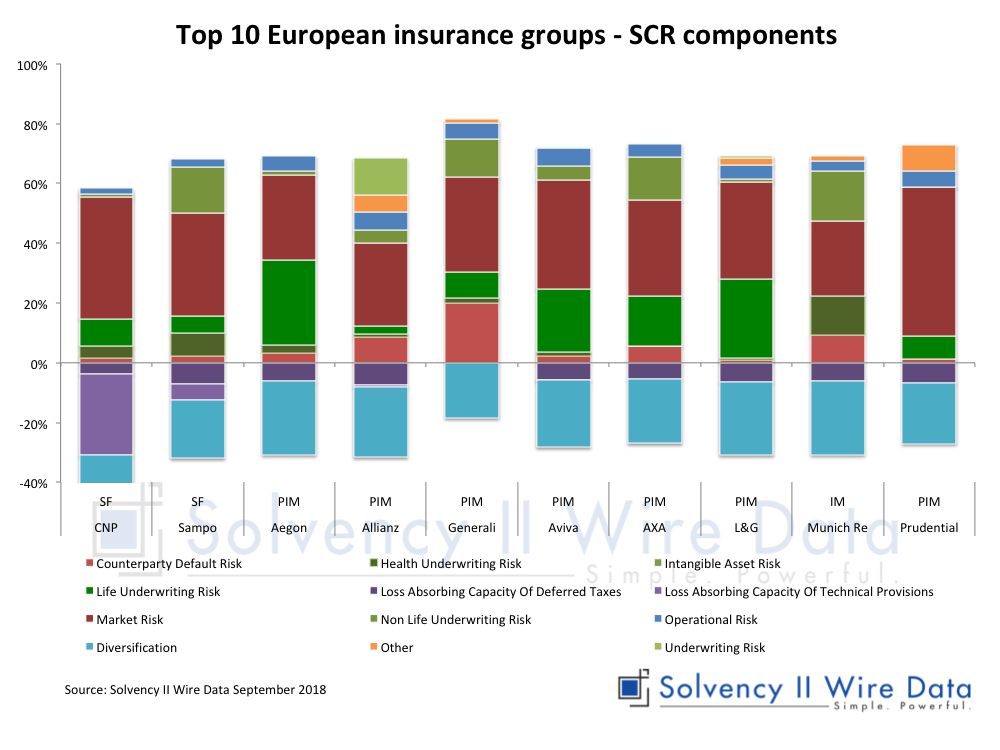
The chart below shows the output of the sample using all components. A number of observations are apparent. Market risk is the dominant component across the sample, followed by Life Underwriting risk. Diversification benefit is the dominant component reducing the SCR across the sample and most firms also have some meaningful amount of LAC-DT (reported within the model components list).
However, the largest single item contributing to the reduction in the SCR is Loss-absorbing capacity of technical provisions reported by CNP, as Standard Formula firm.
For the SF firms diversification is reported from the ‘Diversification’ cell (S.25.01__R0060_C0100). The chart also includes the diversification cell R0060_C0100 for the IM and PIM firms, which is reported in template S.25.02 and S.25.03 respectively. The inclusion is problematic as in some cases the firms also report diversification within the list of individual model components.
The latter point demonstrates some of the difficulties of comparing across the PIM and IM firms as it can often be unclear if diversification is included in the components or if it is applied separately in the same way that it is reported in the Standard Formula. Only Legal & General and Prudential included component-specific diversification in their disclosure.
Furthermore, Prudential also included an item called ‘Total of undiversified components’ in the list of components in template S.25.02. This is not included in the chart, as it appears to be a subtotal that it does not have a unique component number in column C0010. For this reason the IM Comparator tool groups all diversification components in the ‘Other’ category. In order to make a more meaningful comparison it could be more effective to strip out the diversification from the charts and look at the undiversified SCR only.
Undiversified SCR Components
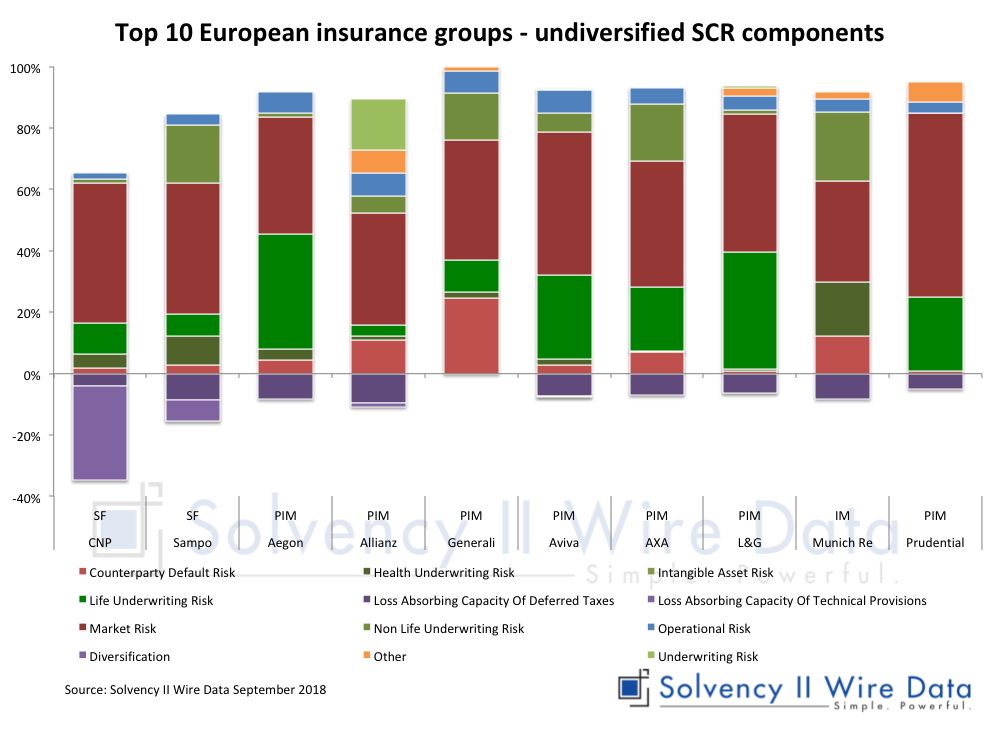
The chart below shows a comparison with the Diversification components removed from the IM and PIM firms as well as the Standard Formula firms.
The revised chart makes for better comparison of the core elements of the SCR, further emphasising the dominance of the risk and underwriting components. It also brings to the fore the impact of ‘Operational Risk’ and highlights the remaining ‘Other’ items, most prominent in Allianz and Prudential.
For Allianz, for example, ‘Other’ includes ‘IM – Business risk’ and ‘IM – Business risk’, which the company SFCR defines as “Risks from entities using the internal model (IM)”. A chart on page 98 of the Allianz Group SFCR 2017 shows that Business risk comprises a range of underwriting risks.
The SFCR further explains: “Business risks include cost risks and policyholder behaviour risks, and are mostly driven by the Life/Health business and to a lesser extent by the Property-Casualty business” and that Business risk is measured relative to baseline plans (page 51).
While the items in the ‘Other’ category are difficult to unpack, the chart does show that such items make up a relatively small part of each respective firm’s SCR.
Market risk vs. non-market risk SCR components view
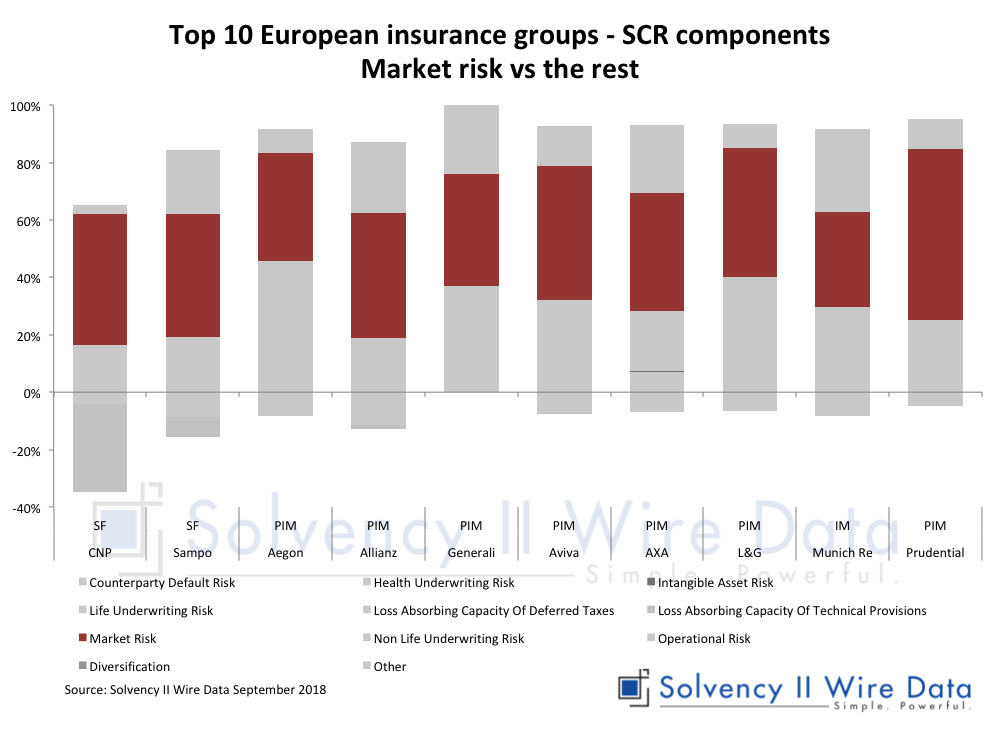
In light of these obfuscations some have suggested that it may be more helpful to reduce the comparison to market and non-market components. The chart below shows the same chart merging all elements except Market Risk.
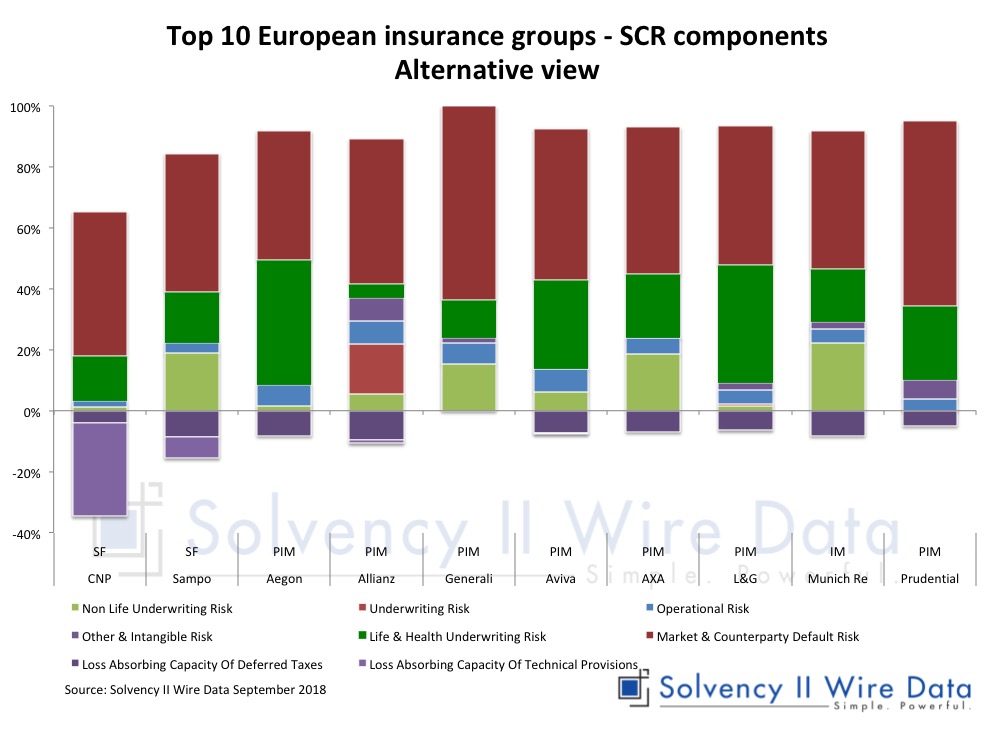
An alternative view of the SCR components
An alternative view of the figures can be obtained using a different consolidation configuration of the categories. The chart below shows the same data with the following grouping: ‘Intangible Risk’ added to the ‘Other’ category; Life Risk and Health Risk grouped together; and ‘Counter Party Default Risk’ and ‘Market Risk’ grouped together.
The quest for comparability
The Solvency II disclosures are far from perfect. But, as we have argued for several years now, they can provide a useful baseline for comparison across the European insurance market, which, together with the narrative disclosures can provide meaningful insights. For now, the quest for comparability in the Solvency II figures continues.
More analysis of SCR ratios of European Insurance Groups
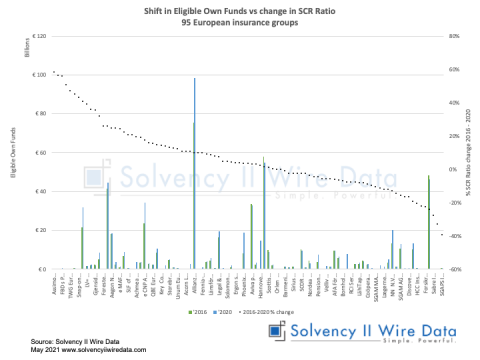
Shift in Eligible Own Funds vs change in SCR Ratio: 95 European insurance groups
Solvency II Group Structure: solos and all entities
Shift in SCR ratios 59 European Insurance Groups 2016 – 2019
The full set of data is available to premium subscribers of Solvency II Wire Data. Find out more here.
Solvency II Wire Data Benchmarking tool
Finding French insurers with more than €1 billion total liabilities