Analysis of the 2020 Solvency II public disclosures (SFCRs & QRTs) of European insurance groups supports the trend of growing capital resilience of the European insurance industry.
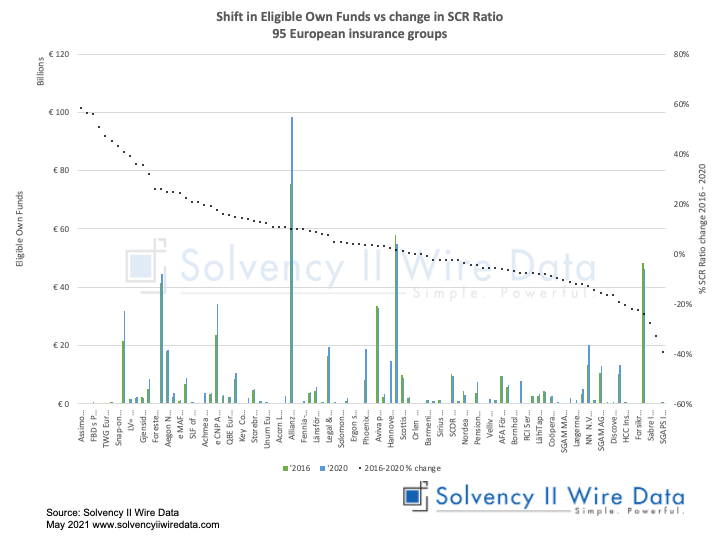
A sample of 95 groups, with a combined total asset value of €6.6 tr (€5.5 tr, 2016), has increased its Eligible Own Funds (EOF) to meet the SCR from €505 bn in 2016 to €632 bn in 2020.
The change in SCR ratio ranges from 59% increase (Assimoco) to a decrease of -39% (SGAPS).
The chart below plots the change in EOF (bars, left axis) against the change in SCR ratio (right axis).
See related charts: Shifts in SCR and MCR Ratios 2016 – 2020 80 European Insurance Groups.
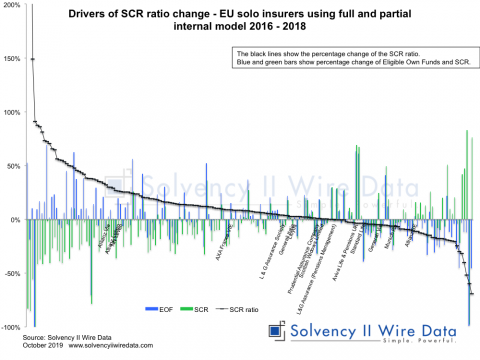
For analysis of Shift in SCR ratios 59 European Insurance Groups 2016 – 2019
See also 1st 100 2020 SFCRs & 500 2020 QRTs packed with insurance data
The sample is based on data from the QRTs of 95 groups that have been fully processed by Solvency II Wire Data.
Solvency II Wire Data collects all available public QRT templates for group and solo.