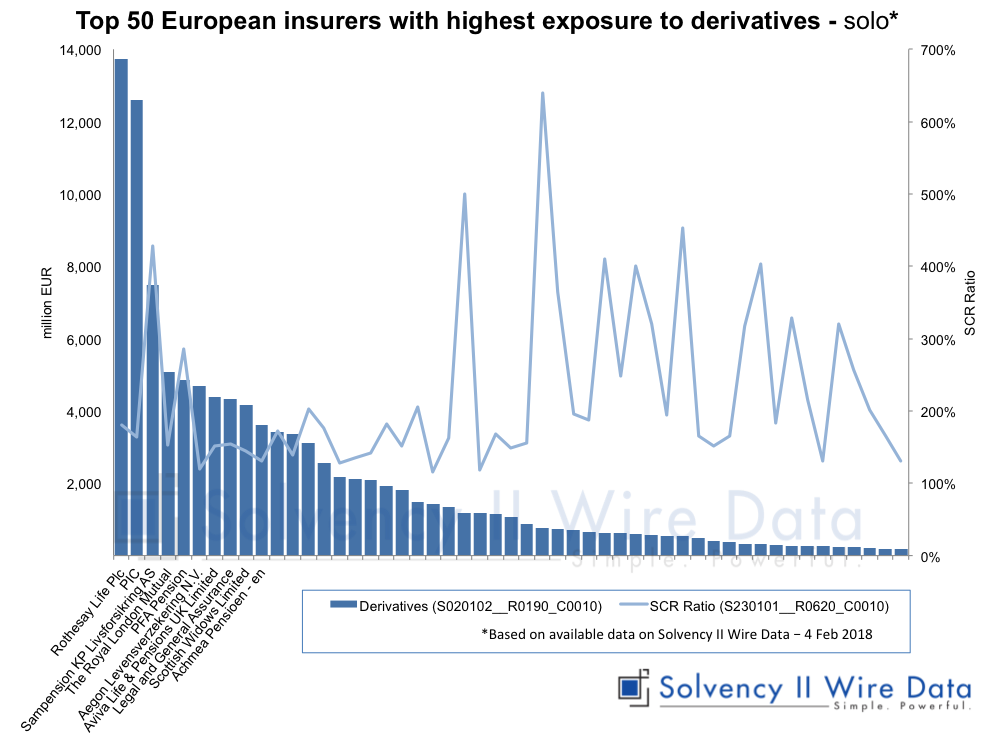
Chart title: Top 50 European insurers with highest exposure to derivative – solo
Description: List of 50 solo European insures with highest exposure to derivatives on their balance sheet (Solvency II balance sheet).
Definition: Derivatives, ITS 2015/2452, page 54
A financial instrument or other contract with all three of the following characteristics:
- (a) Its value changes in response to the change in a specified interest rate, financial instrument price, commodity price, foreign exchange rate, in dex of prices or rates, credit rating or credit index, or other variable, provided in the case of a non–financial variable that the variable is not specific to a party to the contract (sometimes called the ‘underlying’).
- (b) It requires no initial net investment or an initial net investment that is smaller than would be required for other types of contracts that would be expected to have a similar response to changes in market factors.
- (c) It is settled at a future date.
Solvency II value, only if positive, of the derivative as of the reporting date is reported here (in case of negative value, see C0010/R0790).
Primary axis: Amount of derivatives in EUR million, Solvency II QRT template S.02.01 row R0190 column C0010
Secondary axis: SCR ratio, Solvency II QRT template S.23.01 row R0620 column C0010
Notes: Solvency II figures, based available data on Solvency II Wire Data — 6 February 2018. Further information available here.