ANALYSIS
Understanding changes the structure of the Solvency Capital Requirement (SCR) of European insurance firms is becoming increasingly important to understanding both their business mix and investment strategy. Although the standard formula categorisation is quite opaque (detailed breakdown of each component of Market Risk, for example, is only given in private reporting) tracking and analysing the changes in the size and relationship of the various components can be informative.
Broken ridge charts
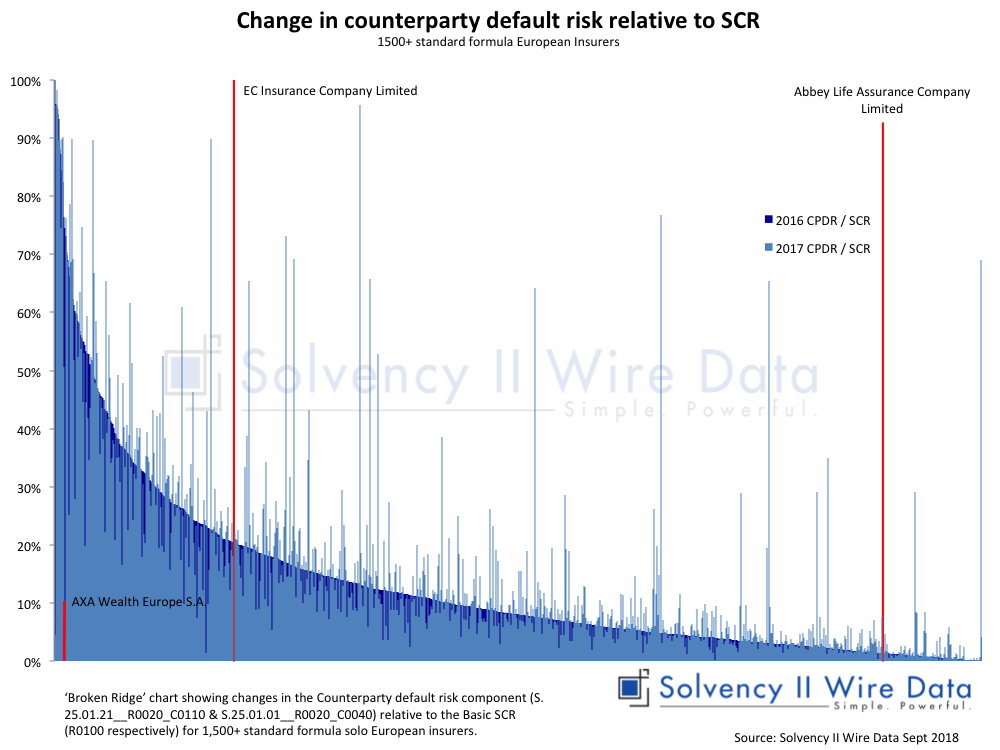
The ‘Broken Ridge’ chart below shows the changes in the Counterparty default risk (CPDR) component (S.25.01.21__R0020_C0110 & S.25.01.01__R0020_C0040) relative to the Basic SCR (R0100 respectively) for 1,500+ standard formula solo firms. ‘Broken Ridge’ charts are specially devised by Solvency II Wire Data to highlight year on year changes across the Solvency II data set. The ‘ridge’ is formed by ordering the initial series (in this case CPDR / SCR 2016) in descending order and plotting it against the second series (CPDR / SCR 2017). Colouring the second series in a lighter shade gives the impression of a ridge, which is ‘broken’ by 2017 values that deviate significantly from the previous year, thus helping to spot outliers and anomalies.
Shifts in counterparty default risk
The chart highlights a number of firms that experienced significant changes in the proportion of Counterparty default risk within the SCR. The largest positive shift (90%) was reported by Abbey Life Assurance Company Limited, a UK life firm. The shift is driven by a significant reduction in the Basic SCR (from GBP 474m in to GBP 77.6m in 2017) and increase in CPDR (GBP 6.5m to GBP 71.8m). The company is part of Phoenix Group, which is in the process of moving its business onto the group internal model (PRA approval was received in March 2018, according to the Phoenix Group 2017 SFCR).
This, in turn, has caused the change in the SCR structure of Abbey Life (ALAC), as explained on page 149 of the SFCR: “For the Abbey Life business acquired in 2016, an application to move the business onto the Group’s Internal Model was submitted to the PRA during the fourth quarter of 2017, with PRA approval received in March 2018. As at 31 December 2017 the Solvency Capital Requirements for the Abbey Life business reinsured to PLL [Phoenix Life Limited] have been determined on an Internal Model basis, as the reinsured business is similar to existing business in PLL. However, for business remaining in ALAC the Solvency Capital Requirements are required to be determined on a Standard Formula basis as at 31 December 2017.”
AXA Wealth Europe S.A., a Luxembourg based life firm exhibited one of the largest negative shifts (-63%, although it is difficult to identify and has been emphasised in the chart for effect). Here the shift is driven by an increase in the BSCR (EUR 0.85m in 2016 and EUR 6.6m in 2017), while the CPDR remains stable at around EUR 0.6m.
The AXA Wealth Europe2017 SFCR (page 73) explains the changes in the SCR and CPDR as follows:
“- A large growth in reserves: from €18.8 million in Q4 2016 to €332.5 million in Q4 2017
– A decrease in counterparty exposure relative to reserves
– A cap of the loss absorbing capacity of deferred taxes to the level of the economic balance sheet (as requested by the Luxembourgish regulator).”
Changes in inter-group reinsurance arrangements, outlined in section 4.5.2 “Material change in Risk Profile during 2017” in the EC Insurance 2017 SFCR (page 25), resulted in counterparty default accounting to almost 100%of the SCR (acronyms refer to various entities in the group):
“The impact of these transactions is to reduce the reserving and underwriting risk to zero at December 2017. Market risk is also reduced significantly to £8,804. ECICL’s main risk is now a counterparty risk with MIICL for the recovery of the amounts due under the LPT and the quota share reinsurance.”
There are many factors that impact the changes in the composition of the SCR. This brief analysis of shifts in the Counterparty default risk could similarly apply to other SCR components.
The full set of data is available to premium subscribers of Solvency II Wire Data. Find out more here.
Solvency II Wire Data Benchmarking tool


