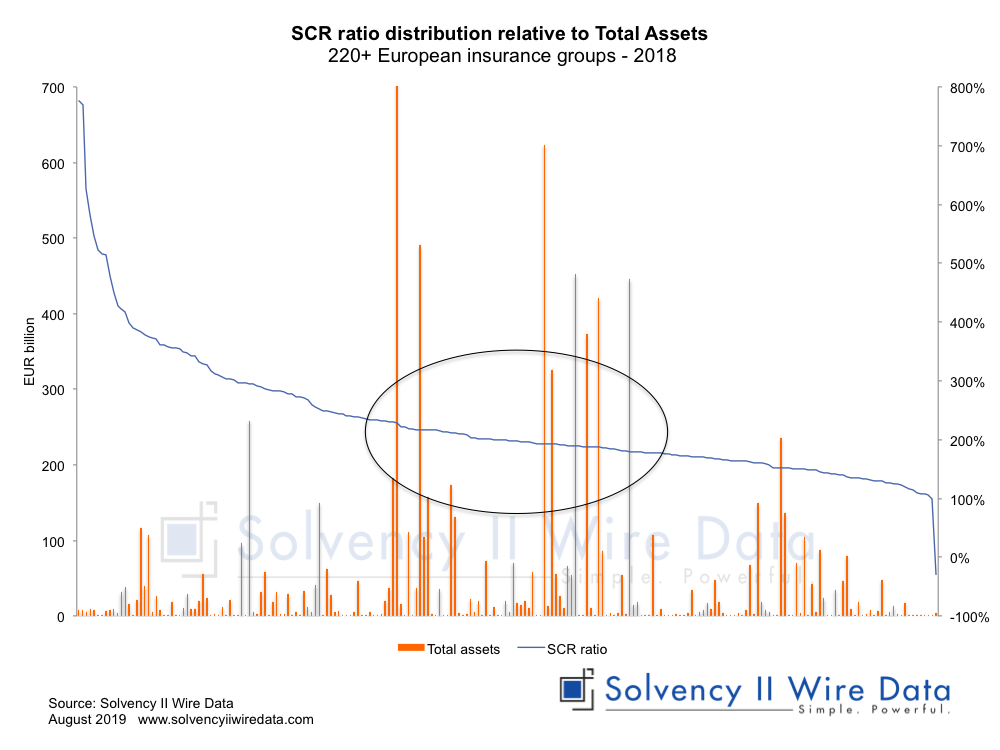
The following two charts show the relationship between total assets and the Solvency ratios of European insurance groups.
The figures are based on data for 220+ European insurance groups as reported in their 2018 Solvency II public disclosures.
The first char shows distribution by total assets. The left axis (bar chart) shows total assets in Euro. The right axis shows the SCR ratio percentage
Although there appears to be no obvious correlation between the two metrics, one observation which can be made is that most of the large groups have a ratio in the region of 200%.
Plotting the data by SCR ratio shows the distribution more clearly.
The data for this analysis was provided by Solvency II Wire Data. The Full set of QRTs for all data in charts is available to Solvency II Wire Data subscribers. Click here to find out more.
Solvency II Wire collects all avaiable public QRT templates for group and solo.
Group templates available on Solvency II Wire Data
S.02.01 Balance sheet
S.05.01 Premiums, claims and expenses Life & Non-life
S.05.02 Premiums, claims and expenses by country Life & Non-Life
S.22.01 Impact of long term guarantees and transitional measures
S.23.01 Own funds
S.25.01 SCR Standard formula
S.25.02 SCR Standard Formula Partial Intern Model
S.25.03 SCR Standard Formula Intern Model
S.32.01 Undertakings in the scope of the group
===