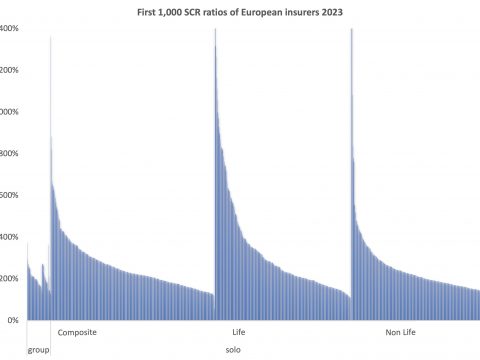
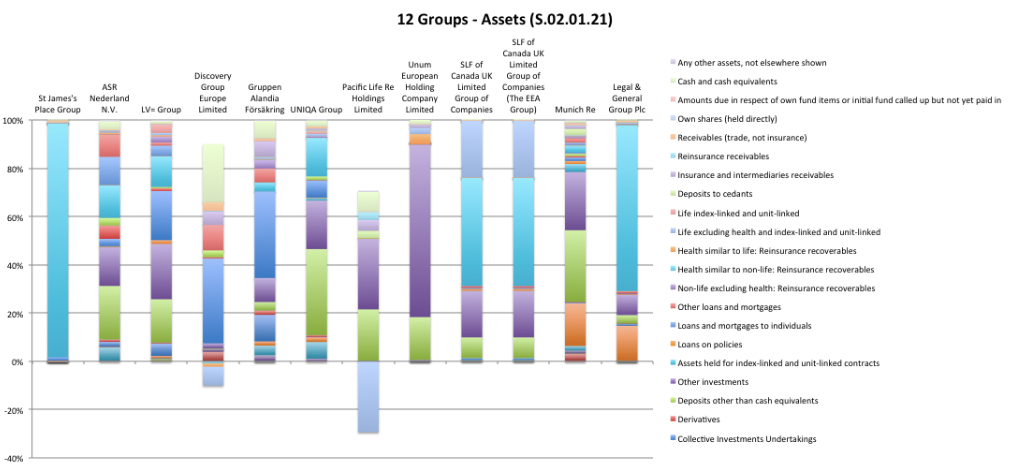
These two charts begin to tell the story of the group public disclosures.
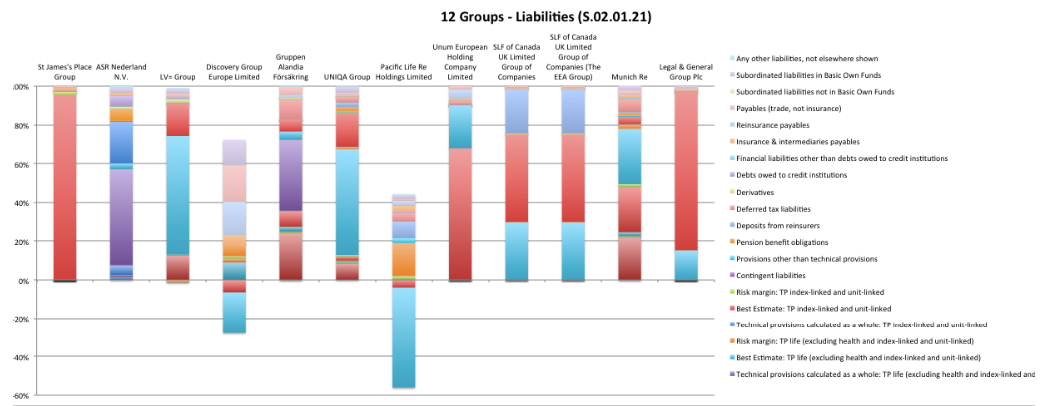
Both tables are generated from the balance sheet template S.02.01.02. A few notable exposures are evident in Assets held for index-linked and unit-linked contracts (St Jame’s Place and L&G), as are broad exposures across the range to Corporate and Government bonds and Collective investment undertakings.
The second chart shows the breakdown of liabilities for the same sample and shows a prevalence of Best estimate Technical Provisions of index-linked and unit-linked liabilities.
20+ group SFCRs and QRTs are available to premium subscribers. A further 40+ are being processed and expected to be available later this week.
The full data set is available on the premium Solvency II Wire Data service. A subset of the data is also available to free subscribers to the service (register here).