Category: SFCR Analysis
Analysis of the Solvency II public disclosures
A cross-border reinsurance spiral
November 6, 2018
Solvency II and equity price valuation
November 5, 2018
Tracking shifts in counterparty default risk
September 25, 2018
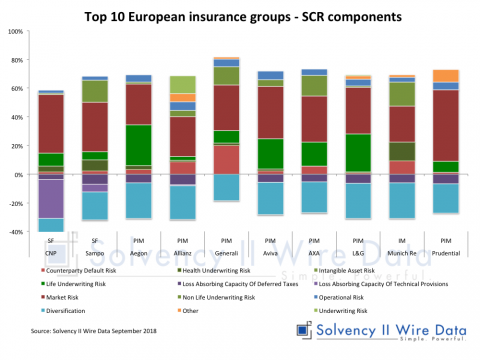
SCR components comparison of European insurance groups
September 11, 2018
Reinsurance and the Solvency II public disclosures
April 24, 2018
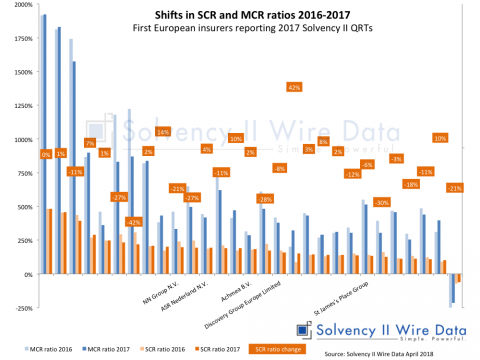
NN Group published SFCR and QRT for 2017
April 10, 2018
SFCR comparison tools – Solvency II Wire Data
April 3, 2018
Top 50 European insurers with highest exposure to structured notes
February 15, 2018
Top 50 European insurers with highest exposure to property
February 13, 2018
Top 50 European insurers with highest exposure to derivative
February 12, 2018
Deconstructing Internal Model SCR components
January 24, 2018


