Category: SFCR Analysis
Analysis of the Solvency II public disclosures
State of Solvency II reporting 2019 (part 1)
April 20, 2020
Insurers slow to publish 2019 Solvency II figures
April 8, 2020
Analysis of EEA Life Insurance Market 2018 SFCR & QRT data
January 22, 2020
Insights from the first 2019 Solvency II SFCRs and QRTs
January 1, 2020
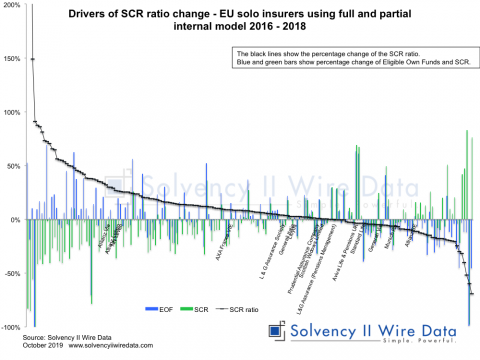
Drivers of Solvency II SCR ratio change across Europe 2016 – 2018
October 23, 2019
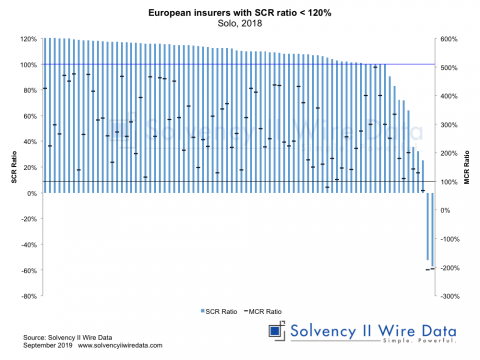
Insight into the lower end of the European insurance market
September 2, 2019
SFCRs 2018 – a market snapshot from early collection
April 24, 2019
Trends in Solvency II ratio distributions
March 25, 2019
Solvency II News: first 2018 SFCRs
December 14, 2018
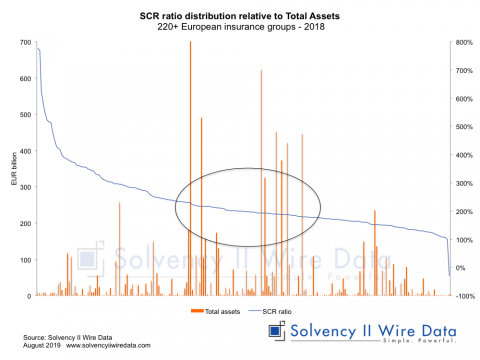
A deep-dive into the Solvency II SCR ratios
December 6, 2018
Putting the Solvency II QRTs to the test
November 16, 2018
A cross-border reinsurance spiral
November 6, 2018
Solvency II and equity price valuation
November 5, 2018

