The European insurance sector’s aggregate Solvency II ratio reached 253% in 2025, up from 244% at year-end 2024, according to interim solo aggregate statistics published by EIOPA in June. The figure lines up closely with predictive analysis conducted by Solvency II Wire Data published as early as two weeks after the official publication date in April.
Correct predictive Solvency II market analysis for third year running
In April, Solvency II ratios expected to rise for year-end 2025, built on a sample of 660 solo insurers with unbroken Solvency II disclosures since 2016, projected the European aggregate ratio would climb to 253% for 2025, driven by eligible own funds (EOF) growing faster than the Solvency Capital Requirement (SCR). By May, with roughly two-thirds of the market’s solo insurers filed, SFCR 2025: 30 days on put the actual reading at 252%, a one-point gap from the original projection.
EIOPA’s interim publication, covering 29 EEA countries on a solo basis, now puts the same figure at 253%.
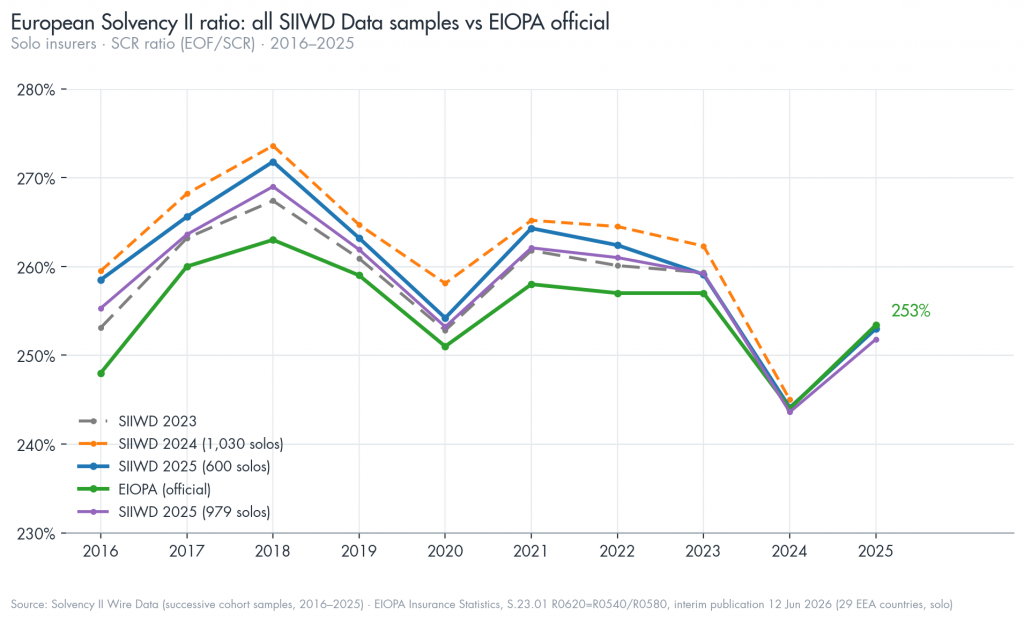
Similar analysis for 2024 and 2023 closely tracked the official Solvency figures as well.
Increase in capital drives rise in Solvency II ratios
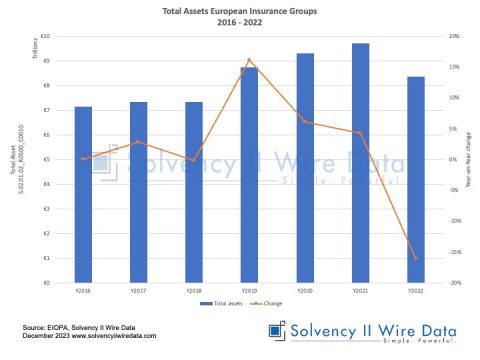
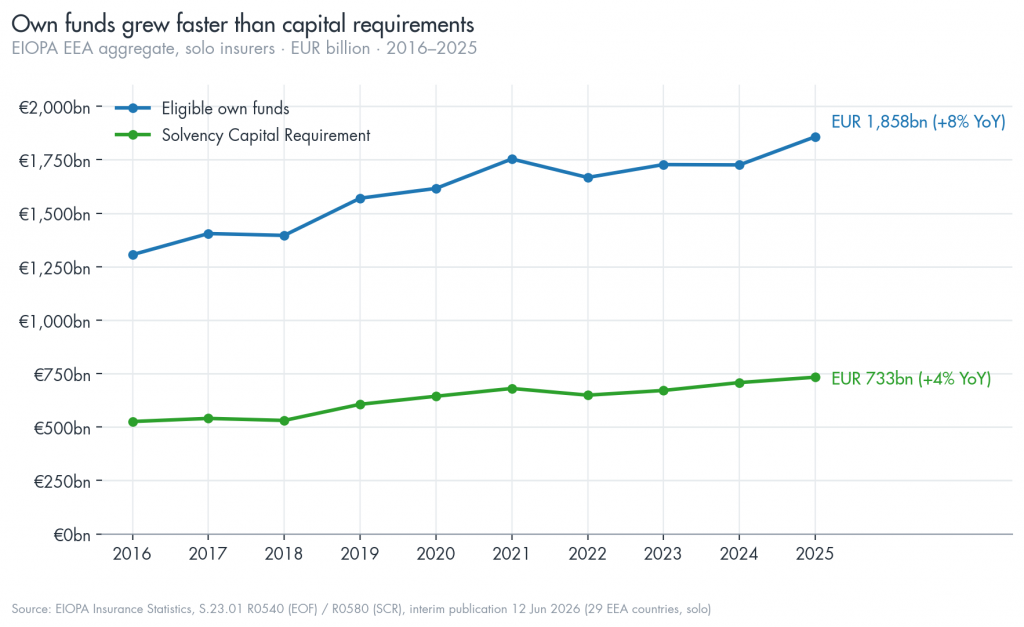
The driver identified in April holds in the official data too. Aggregate eligible own funds across the EEA solo population rose 8% year-on-year to EUR 1,857.7 billion, more than double the 4% increase in the Solvency Capital Requirement, to EUR 733.1 billion. Total assets rose 4% to EUR 10,691.8 billion: a third consecutive year of growth since the 2022 low.
Conclusion
The alignment between the April projection, the May filed-data reading and EIOPA’s own June figures suggests the tracking relationship between Solvency II Wire Data samples and the EIOPA official statistics, documented across 2016–2024, extended into the 2025 reporting cycle without material drift. This has some bearing on how early-cohort samples might be used going forward, potentially narrowing the gap between the SFCR filing window and a reliable market-wide reading. It may also allow commentary that currently waits for EIOPA’s own publication schedule to be supplemented, with appropriate caveats, by earlier estimates in future cycles.