Analysis of the solvency ratios of 1,700 European insurance companies collected and processed by Solvency II Wire Data 30 days after the official publication date (8 April 2024 for Solvency II and 9 April for Solvency UK) shows the distribution of ratios across group and solo insurers in the UK and Europe.

Solvency II capital ratios down
Predictive analysis of 1,030 solo European insurers that have published their Solvency II SFCRs and QRTs for all nine reporting years (2016 – 2024) indicates that in 2024 Solvency II ratios are down relative to 2023.
The ratio of the sample dropped from 262% in 2023 to 245% in 2024 (see chart below).

As can be observed, the sample, which covers EUR 7.8 trillion in total assets, tracks the EIOPA offical statistics.

A similar sample of 1,200 solos in 2023 proved a reliable indicator of market trends. The large 2024 sample also closely tracks a sample of 600 firms (dotted line) published two weeks after the official publication date of the 2024 SFCRs.


Solvency II capital ratios by country
Analysis of individual country Solvency II ratios based on the sample shows that in almost all countries the SCR has increased relative to 2023, where as Eligible Own Funds (EOF) fluctuated much more.

Rising levels of Tier 2 insurance capital
The sample represents EUR 1.44 trillion of EOF (EUR 1.46 trillion in 2023). The chart below shows the EOF distribution in each country.
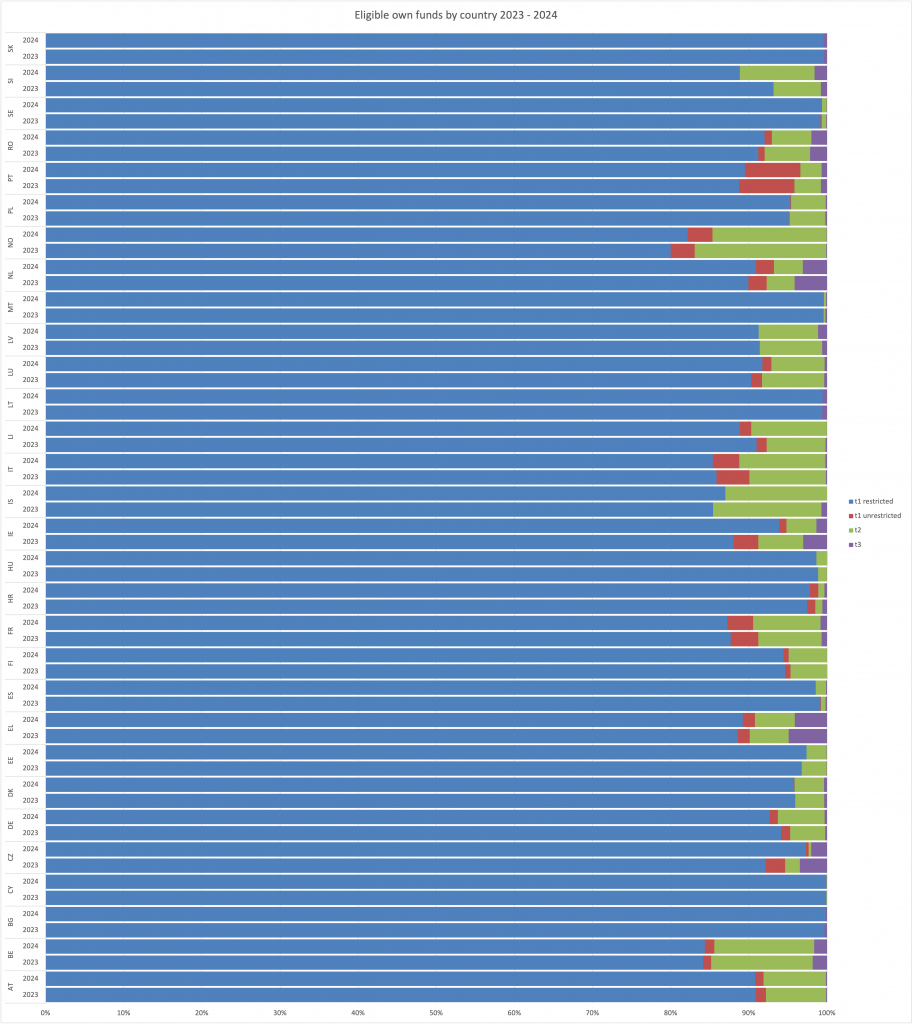
The total tier 1 restricted capital and tier 3 capital remained stable (EUR 1.3 trillion and EUR 8.3 billion), while more significant changes took place in what appears to be shift from tier 1 unrestricted capital to tier 2 capital.
The total tier 2 capital rose from EUR 85.8 billion to EUR 93.8 billion, while tier 1 unrestricted capital dropped by 9% to EUR 29.1 billion in 2024.
Reporting schedule: Solvency II and Solvency UK
The Solvency II 2024 group SFCR publication date is 20 May 2025. The Solvency UK 2024 group SFCR publication date is 27 May 2025.
The Solvency II 2025 SFCR reporting schedule, which can be found in the EIOPA Taxonomy Roadmap – Updated 15 Nov 2024, is 8 April 2026 for solo insurers and 20 May 2026 for group.
2025 SFCR reporting schedule for Solvency UK is 13 April 2026 for solo insurers and 27 May 2026 for group.
Weekly Lunchtime Webinar Series: 2024 SFCRs weekly reporting update
Wednesdays throughout May 2025, 12.00 UK / 13.00 CET
A weekly update on the state of the Solvency II and Solvency UK 2024 SFCR reports, including early market analysis from Solvency II Wire Data.