Early analysis of the 2024 SFCRs of 600 solo European insurers, which account for over half of the market size, points to rising levels of assets under management (AUM) alongside a drop in capital ratios.
The analysis is based on data extracted by Solvency II Wire Data from the QRTs of 600 insurers that have published data for all years between 2016 – 2024.
Insurance AUM in 2024
The value of the total AUM of the sample (based on the Total Assets, cell S020102__R0500_C0010 in the QRTs) is EUR 5.5 trillion (EUR 5.3 trillion in 2023). In 2023 the full market total was EUR 9.3 trillion, based on the official annual statistics published by EIOPA.

The figures point to rising levels of total assets, continuing the trend following the dip in 2022.
The 2024 sample closely tracks the full sample of 1,200 reports used in 2023, which proved to match the official figures published in September 2023.
Insurance eligible capital dipping
The Eligible Own Funds of the sample (EOF, the Total eligible own funds to meet the SCR, cell S230101__R0540_C0010) closely tracks the 2023 and EIOPA samples until 2022.

However, from 2023 the new sample diverges from the other two, pointing to a downward trend in insurance eligible capital in 2024; down from EUR 882.1 billion to EUR 913.7 billion in 2024 respectively.
Solvency capital requirement up
The Solvency Capital Requirement (SCR, cell S230101__R0580_C0010) of the 2024 sample is on the rise: EUR 354.8 billion, up from EUR 340.5 billion in 2023.

The SCR figures of the 2024 sample closely track the previous figures until 2023, with a downwards divergence in 2024.
2024 solvency ratios descending
The solvency ratio of the sample (Ratio of Eligible own funds to SCR, cell S230101__R0620_C0010) is 249%, down from 268% in 2023.

Last year’s sample ratio was 259% compared to the EIOPA ratio of 257%.
The ratio of the Solvency II Wire Data samples is calculated by dividing the total EOF of the sample by the total SCR.
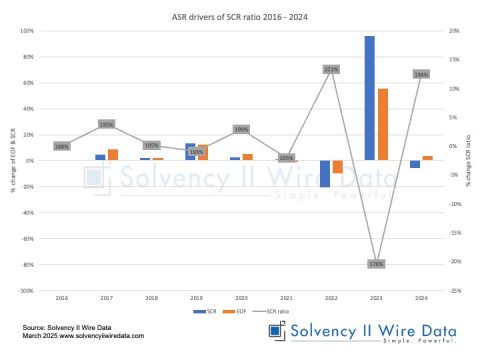
A tumble of insurance capital ratio in 2024?
The most dramatic finding in this early analysis of 600 European solo insurers based on their 2024 SFCRs is the potential tumble in the insurance capital ratio by a difference of 19%.
To gauge the accuracy of the figures as an indicator of the total market coverage it is worth considering the merits and limitations of using such a sample.
The fact that both the 2023 and 2024 Solvency II Wire Data samples closely track the official EIOPA figures lends strong support to the credibility of such an exercise in predicting the full market figures.
However, there are some notable divergences, particularly in relation to the EOF and, of course, the ratio itself. This was also noted in the full 2023 sample.
In addition, the analysis does not take into consideration the size of the companies, lines of business or use of capital model. Rather it is fairly random, based on firms that have published data for all years and, in the case of 2024, the availability of data and speed of data processing.
What can be said at this early stage of the process (see for example here and here) is that, relative to last year, the figures appear to be a lot more varied. And, at the risk of having to eat my hat, I would predict ratios will be down in 2024.
To hear my thoughts on the 2024 figures join me for our weekly webinar series.