Analysis of the SFCRs of +1,600 European and UK insurance companies collected and processed by Solvency II Wire Data 30 days after the official publication dates shows the solvency ratios rising across Europe, while declining in the UK, reversing parts of the picture reported last year.
The 30-day sample represents about two thirds Solvency II solo insurers (relative to EIOPA 2024 market coverage), 42 Solvency II groups, and 180 Solvency UK firms.
SCR ratio peaks chart: the story so far
The 2025 distribution of SCR ratios across the full sample shows a small number of outliers above 600%, with the majority of solos and groups clustered between 100% and 400%.
Up and Down chart points to upward trend
Most of the firms have comparable SCR ratios reported for both 2024 and 2025 and form the basis of the year-on-year movement figures discussed below. All SCR ratios are aggregate (total EOF divided by total SCR).
The Up and Down chart, introduced by Solvency II Wire Data this year, shows firm-level year-on-year movements in the ratio across the sample.
Just over half the sample (880 firms) reported a higher ratio this year, 43% reported a lower ratio and 1.5% were unchanged.
EU and UK diverging paths of solo solvency ratios
Across the solo firms the two regimes diverge: the ratio of the Solvency II sample rose from 243% to 252% in 2025, while the UK sample (which also includes Gibraltar, Guernsey and the Isle of Man) saw the ratio drop from 192% to 189%.
Solvency ratio movement by country
Solo country-level SCR ratios analysis shows the divergence of ratios of individual countries across the two markets.
The movement is mixed at country level, with Gibraltar, Germany, Austria, Italy, Portugal, Croatia and Estonia among the larger risers; Luxembourg, Norway, Ireland, Denmark, the United Kingdom, Iceland, Liechtenstein, Latvia, the Netherlands, Slovenia, Spain and Sweden among the larger fallers.
Total assets coverage relative to the EIOPA 2024 universe is shown on the right axis (triangles), which gives an indication of the level of the coverage, and hence the accuracy of the figures for relative to the entire market.
Predictive analysis: two samples converge
The predictive analysis, first introduced two years ago, compares Solvency II Wire Data samples to the official EIOPA Solvency II figures.
This year two 2025 samples are tracked: a 600-solo two-week snapshot taken shortly after the 8 April 2026 publication date, and the 979-solo sample collected by the 30-day cut-off.
The samples include only firms that have data for all years (2016 – 2025), the earlier 1,030-solo SIIWD 2024 sample and the SIIWD 2023 sample are shown for reference.
On all four metrics – total assets, SCR, EOF and solvency ratio, the Solvency II Wire Data samples track the EIOPA official statistics. It is therefore likely to assume that the European 2025 ratios are on the rise.
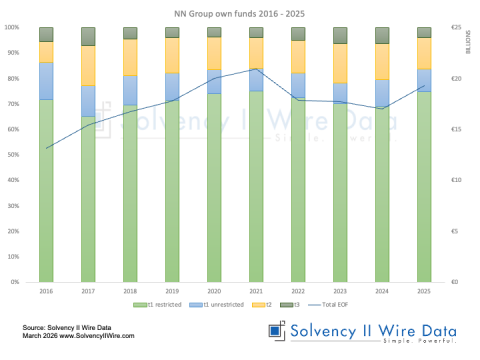
Own funds by country
At country level, tier 1 unrestricted capital dominates the solo Eligible own Funds to meet the SCR (EOF) mix in most markets. The most notable tier 2 contributions are visible in Norway (around 16% of EOF in both 2024 and 2025), Belgium (around 11%), France and Italy (around 10%) and Liechtenstein (around 9% to 11%). Tier 3 capital remains a small fraction of EOF across the sample, with Czech Republic and Gibraltar the only countries above 2%.
Year-on-year, the levels of tier 1 unrestricted share rose in 24 of the 33 countries, while tier 2 fell in 24 countries and rose in only 7.
The tier mix in 2025 is therefore tilting further towards the highest-quality capital across most of the European market.