Second edition of the European captives’ annual survey by SCOR, based on the Solvency II reports (SFCR)

Following from last year’s publication, SCOR published the second edition of its Annual Survey of the European Captives Insurance Market. In this article Julien Mattei, Underwriter at SCOR Alternative Solutions, discusses the aims of the study: expanding the understanding of the European captive market based on the Solvency II publications.
A growing Captive market
A growing number of corporate groups in Europe believe that captives have a key role to play in their risk management strategies. As a result, we have seen a rise in the number of captives in Europe over the past two years, which is mostly driven by increasing (re)insurance premiums, higher retentions, and the capacity constraints on the market for emerging risk as cyber. In France, for example, the government is currently working on an amendment to ease the creation of reinsurance captives.
Despite a growing market, public information available on captives remains limited, since they operate internally.
The sample
SCOR has identified over 350 licensed European insurance or reinsurance companies acting as captives. Within the sample, 175 companies meet our selection criteria, i.e., we were able to gather comprehensive financial information, they write P&C risk3 and belong to an industrial or commercial entity2 that can be identified.
While we believe the selected sample is large enough to be representative of the European captive landscape, it is by no means exhaustive.
Compared to last year’s publication, the considered sample has been refreshed: some companies have been excluded, while others have been added after in-depth research.
Methodology and approach of the survey
By leveraging the opportunities provided by the Solvency II disclosure requirements for insurance companies in Europe, including the annual publication of the Solvency and Financial Conditions Reports (SFCR) and the standardized quantitative reports (QRTs), the study provides statistical analysis on the following topics: captive and parent company domicile, breakdown of premium, assets and reserves by line of business or category, solvency ratios and capitalization.
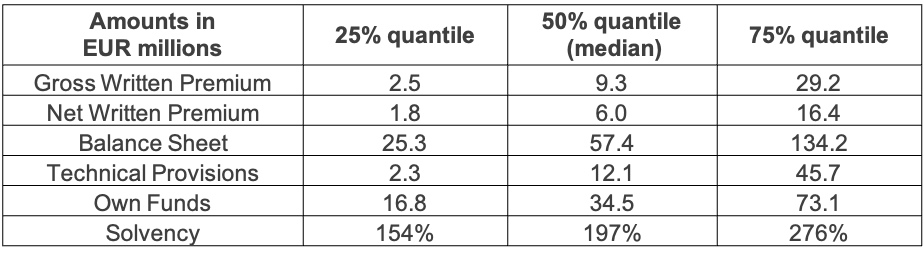
Furthermore, this year we categorize the captives based on their size, which has made benchmarking more relevant.
For example, the average gross written premium of the captives is EUR 26m[GB2] , but half of them write less than EUR 10m, whereas the top 10% writes more than EUR 100m.
In addition, their business mix, reinsurance strategy, asset allocation or capitalization ratios can differ significantly.
The analysis is based on median quartiles, which reflects more accurately the heterogeneity of the captives and isolates the outliers.
Risk coverage and asset mix of European Captives
The segmentation by quartiles shows that larger captives tend to cover a wider range of risks relative to smaller ones.
On the balance sheet, the assets portfolio mix varies with the captive size: larger captives tend to invest more in corporate and government bonds than smaller ones (see chart below).
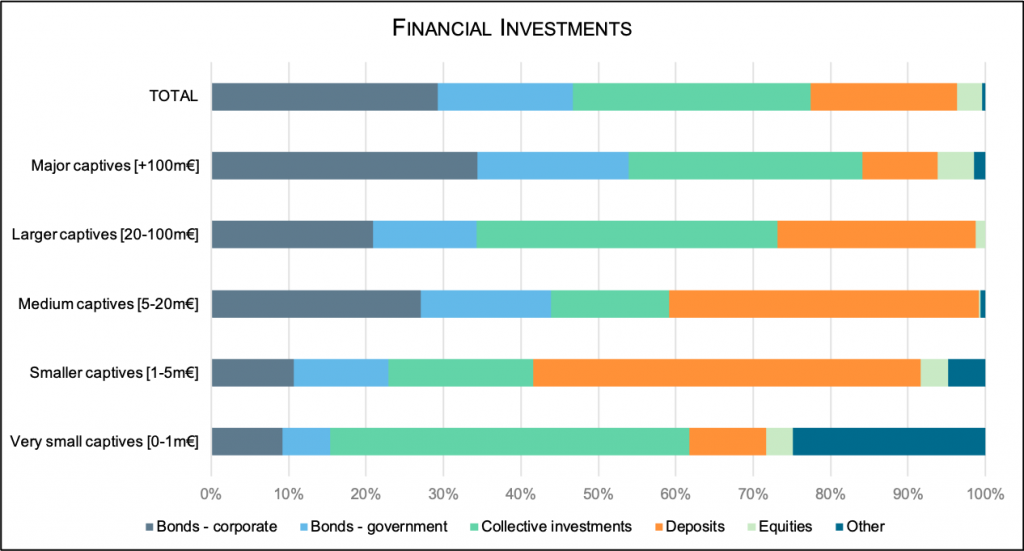
SOURCE: Solvency II Wire Data
Benchmarking captives by group headquarters country
This year’s survey introduces benchmarking based on the group headquarter country (8 countries available in the study). The benchmark by sector of activity has also been updated with the latest data (10 sectors in the study).
The new benchmarks provide insights for the captive’s risk managers to compare key metrics to their peers as: domicile of the captive, number of lines of business and solvency ratios.
Case study: a captive manager of a Swedish group
The captives of Swedish groups have a median GWP of EUR 9.6m and a median solvency position of 196%, thus the group is rather representative of the overall distribution.
The survey provides insights regarding the domicile and the number of lines of business written by all the captives of all the Swedish groups (see charts).
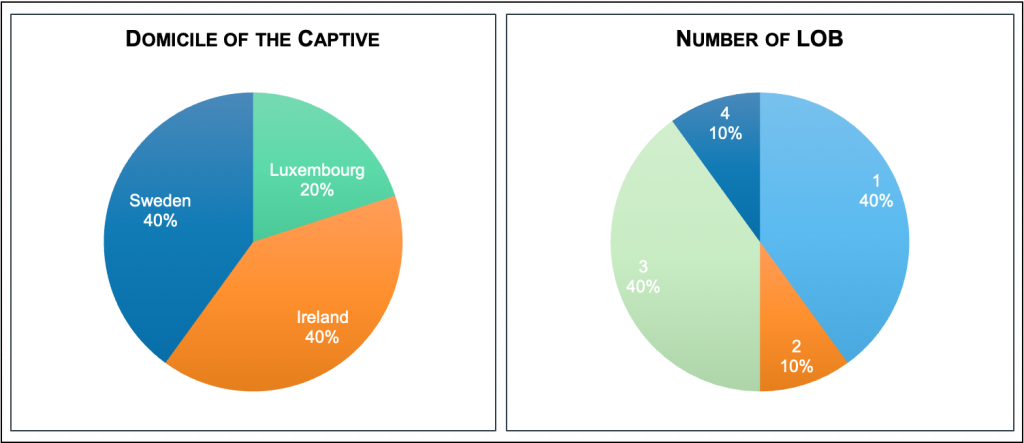
SOURCE: Solvency II Wire Data
40% of the group’s captives are domiciled in Sweden, 40% in Ireland and the remaining 20% in Luxembourg.
The captives write between one and four lines of business. 40% write only one line of business and 40% have three.
In the selected sample, there are 10 captives of groups domiciled in Sweden, named here SW01 to SW10. The chart below shows their gross written premium split by line of business: [GB3] [MJ4]
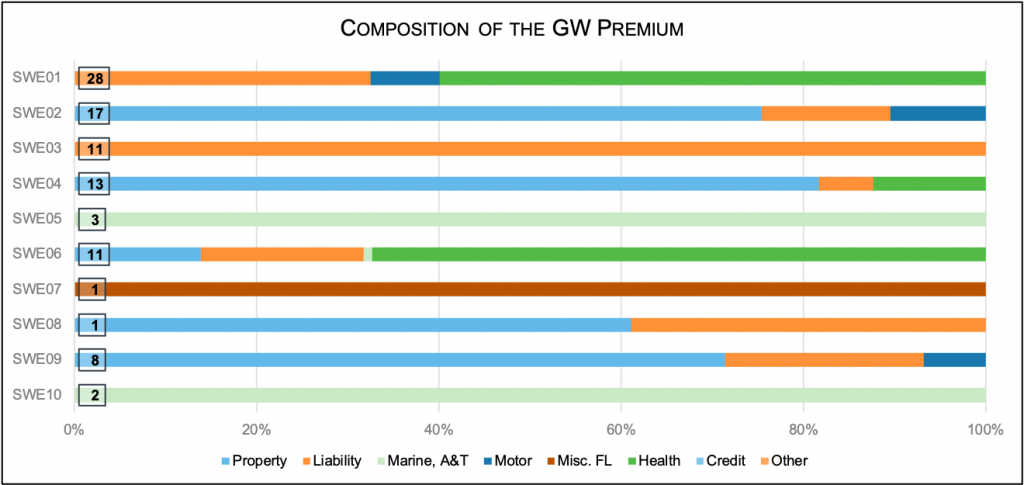
SOURCE: Solvency II Wire Data
From a captive owner perspective, we hope this allows to benchmark their own captive (and more generally their risk management strategy) with their peers in the same territory.
Similarly, captive managers can also compare the Solvency ratio, Eligible own funds and Solvency capital requirement with peers as can be observed in the chart below.
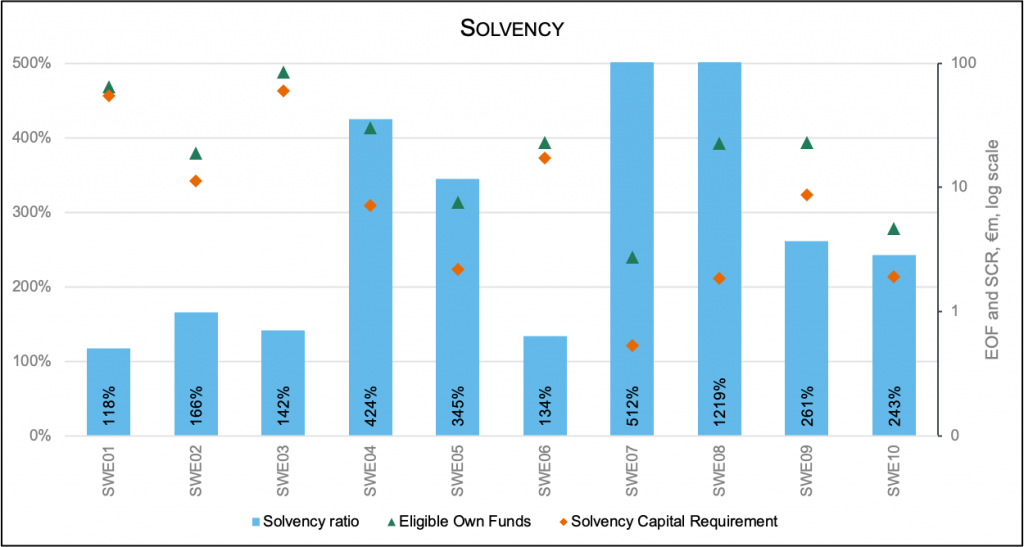
SOURCE: Solvency II Wire Data
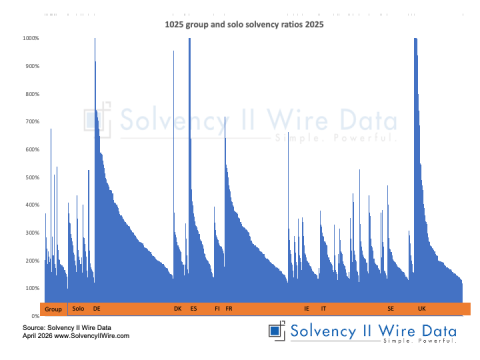
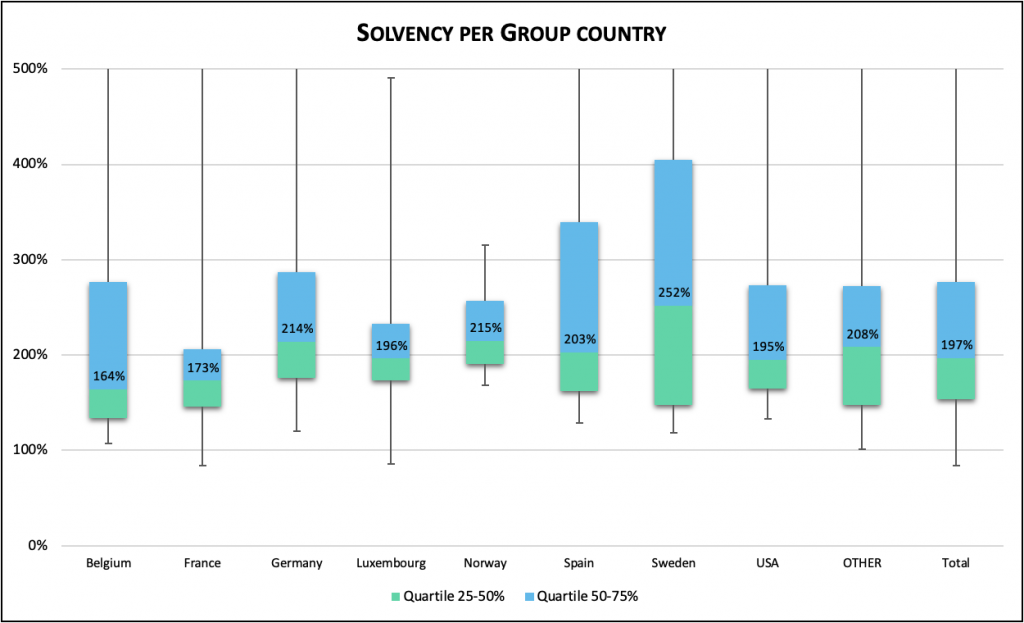
It is also possible to compare the captives’ strategies across different regions. The study includes is a comparison of the solvency ratio distribution by country of the parent company.
For example, if we compare France and Belgium, the average solvency ratio is around 170% but the distribution is significantly different: in France the solvency ratio distribution is much more concentrated around the mean than in Belgium.
SOURCE: Solvency II Wire Data
Conclusion
The second edition of the European captive market study expands the analytics by enlarging the sample (over 350 licensed European insurance or reinsurance companies) and developing a statistical approach based on quantiles.
The aim of the study is to give key financial metrics to the captive managers in Europe and compare to their peers. One takeaway from the study is the significant disparity in the solvency ratio distribution across European countries. An interesting study should be to expand this solvency ratio distribution analysis to all insurance companies (not only captives) in Europe.
—
The author is an underwriterat SCOR P&C Alternative Solutions. The views expressed are the author’s own.
Download the full report: EUROPEAN CAPTIVES: Analytical review of Solvency II reports – NOVEMBER 2022
1 The data from the SFCR reports was sourced using Solvency II Wire Data.
2 Captives of insurance groups have been excluded; captives of banking groups have been included when they manage only the bank’s operational risk exposure.
3 Run-off captives excluded.