Captive insurers and reinsurers shed light on the risk management practices of the world’s largest industrial and commercial groups

The opacity of the captive insurance market has long frustrated captive managers, (re)insurance brokers and other (re)insurance market participants. In this article Jacky Mochel, chief technical officer, SCOR P&C Alternative Solutions, discusses some of the findings of the first comprehensive survey of the European captive market based on the Solvency II public disclosures.
—
First annual survey of captive insurance based on the SFCR reports
Most of the world’s largest industrial and commercial groups manage insurable risks through a “captive” insurer. Although there is no common agreement of what constitutes a captive, it can be broadly defined as an internal entity that centralizes different risks from across the business units and subsidiaries of its parent company and organizes the group’s risk retention in a consistent and efficient manner.
Captives are key to the risk management strategies of industrial and commercial groups. Yet there is limited public information available on these entities, both individually and as a market. Part of the reason for that is that they only operate internally and therefore their financials are not reported in the parent company’s consolidated financial statements.
To provide a better understanding of captives and help us to develop and adjust the range of insurance and reinsurance services we provide to the groups involved, SCOR has conducted a comprehensive overview of the European captive insurance market and the risk management strategies operated by captive owners.
Analytical review of Solvency II reports of European captives
Captives need an insurance or reinsurance license to operate, even when there are no policyholders outside of the group. In Europe they must comply with insurance regulations, namely Solvency II.
Leveraging the opportunities provided by the Solvency II disclosure requirements for insurance companies in Europe including the annual publication of the Solvency and Financial Conditions Report (SFCR) and the standardized quantitative reports (QRTs) we were able to identify and gather financial information on more than 200 captives in Europe*.
The study we conducted based on this data includes market figures and benchmarks on insurance premiums, incurred loss ratios, balance sheet size, asset allocation, capital, and solvency. It was made available to the captive community at the European Captive Forum in November 2021.
Captive insurance asset size and allocation
To demonstrate how the Solvency II data can be used to analyze the captive market we review balance sheet information provided in the QRTs.
The total assets held by captives within our sample amount to EUR 23,000 million as at the 2020 year end.
The average balance sheet size is EUR 123 million. However, this is very heterogeneous, with certain captives exceeding EUR 1,300 million and others standing at less than EUR 5 million.
Almost all the captives in the sample (96%) reported some cash or cash equivalent assets. Most (69%) also reported some financial investments. Together, these represent just over half of the total assets on the balance sheet of the sample.
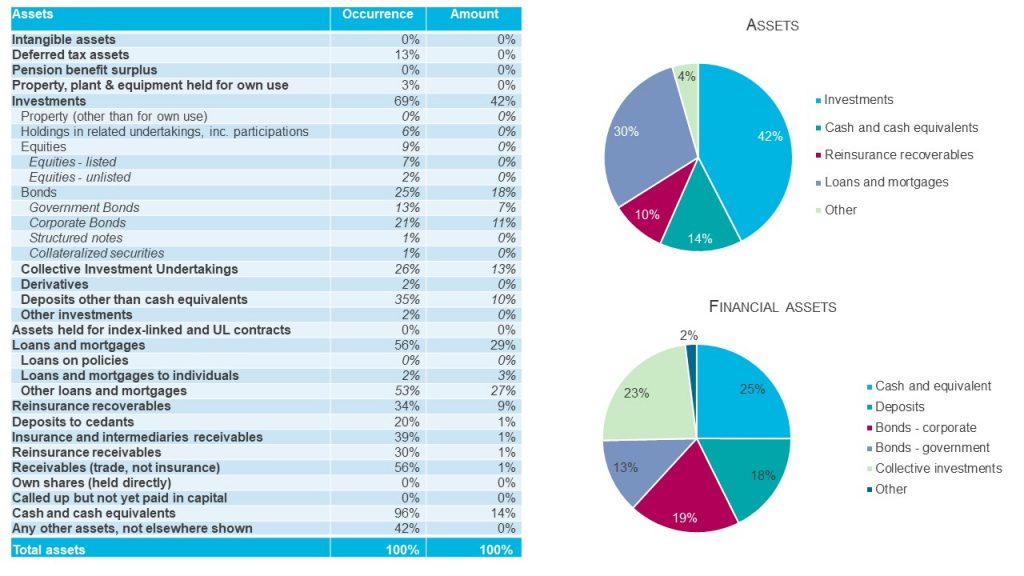
Only one third of the captives (34%) hold reinsurance recoverables. Other assets are made up of deposits to cedants, insurance and reinsurance and other receivables.
Sizable loans and mortgages portfolios
The second largest item on the asset side of the balance sheet is loans and mortgages (29% of the sample amount, reported by 56% of the captives in the sample). There is limited information available here: “loans on policies” is 0%, “loans and mortgages to individuals” is 2% and the remaining 27% are reported as “other”. This category is expected to include loans to related companies.
Limited captive exposure to alternative investments
Investments are made up of corporate and sovereign bonds, collective investment undertakings, deposits and cash. There are hardly any investments in real estate, equities, participations, collateralized securities or derivatives.
Captives and insights into risk management practices
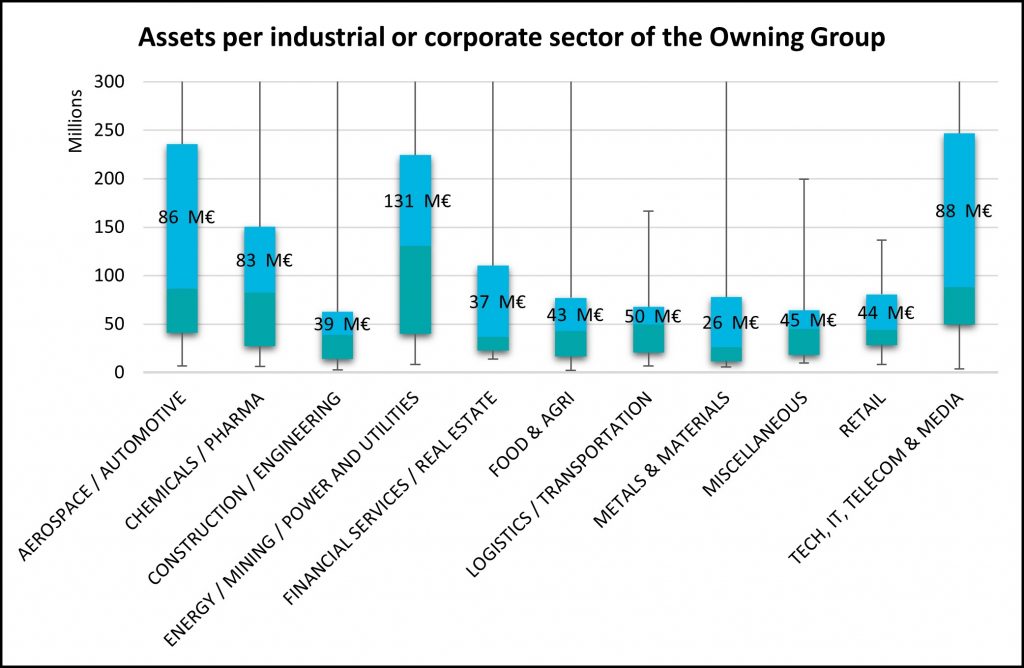
Analysis of the captive market provides valuable insight into the risk management strategies of major industrial and commercial corporations, such as pooling and retention, access to the reinsurance market, and asset strategies. Interestingly, the study shows that every group has its own particular strategy – there is no general trend, whether by country, industrial sector or size.
By looking at an extensive set of captives we shed new light on the corporate (re)insurance business, which we believe is valuable information not only for reinsurance companies like SCOR, but also for public authorities and regulators when assessing the risk management practices of the major corporations in their jurisdictions.
—
– The author is chief technical officer at SCOR P&C Alternative Solutions. The views expressed are the author’s own.
– Download the full report European Captives: Analytical Review of Solvency II Reports by Jacky Mochel, chief technical officer, Alternative Solutions – SCOR P&C, and Mathieu Pasqual, deputy CUO, Specialty Insurance Alternative Solutions – SCOR P&C.
*The data from the SFCR reports was sourced using Solvency II Wire Data.