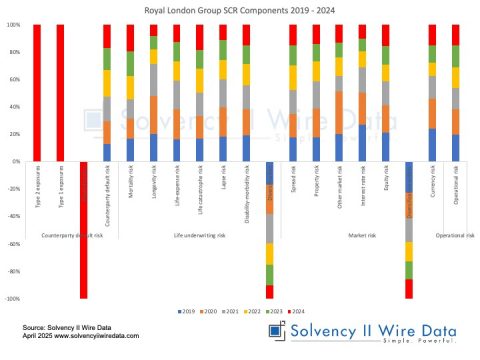
Royal London Group SCR Components 2019 2024

Royal London Solvency UK SFCR 2024: Type 1 and Type 2 exposures

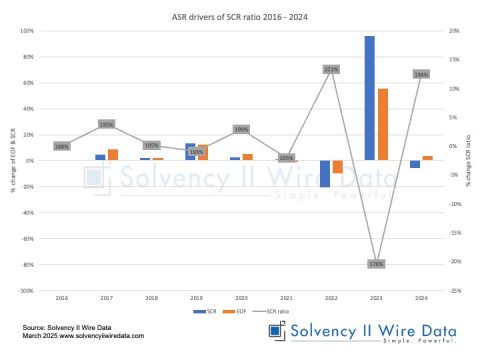
ASR drivers of SCR ratio 2016 2024

ASR 2024 SFCR: bouncing back and dropping tier 3 capital

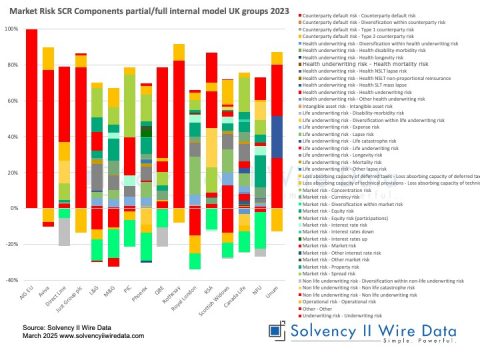
Market Risk SCR Components partial/full internal model UK groups 2023

St James’s Place 2024 Solvency UK report: existing investment trend disclosed

A guide to the Solvency UK public disclsoures

A guide to the Solvency UK public disclosures

Surviving a breach in the SCR ratio

Aggregate eligible own funds ratio across the market

8th annual Solvency II survey: balancing risk and opportunity

Dutch insurance market analysis 2023

EIOPA Solvency II Insurance statistic 2023 (update)

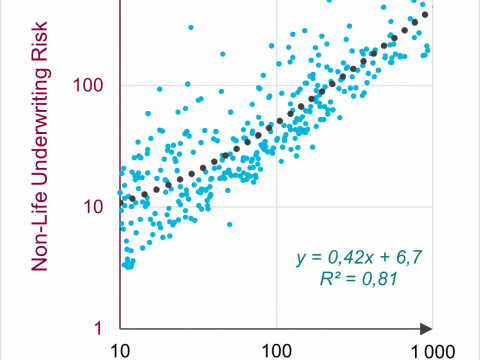
Correlation between the Non-Life Underwriting SCR and the Net Written P&C Premium

Non-life underwriting risk, net premiums and reinsurance under Solvency II

Switzerland insurance market analysis 2023

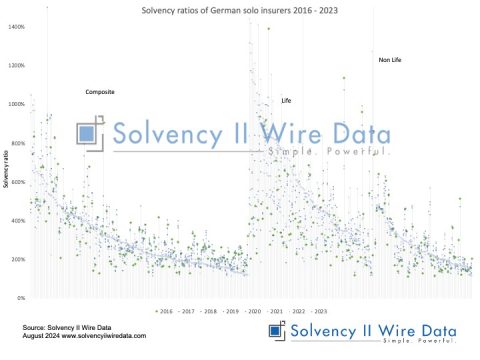
Solvency ratios of German solo insurers 2016 2023

Analysis of the German insurance market 2016 – 2023

Luxembourg insurance market iinsights from Solvency II Wire Data

Luxembourg insurance market insights 2023

European insurance market assets and capital expected to rise in 2023

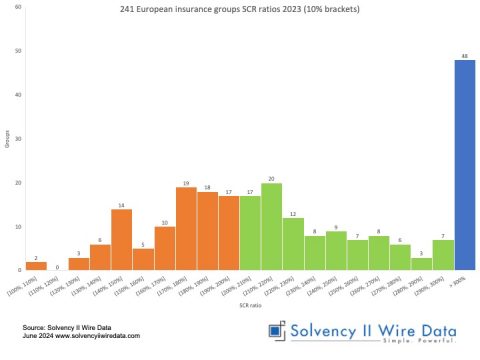
Distribution of group SCR and MCR ratios of European insurers 2016 – 2023

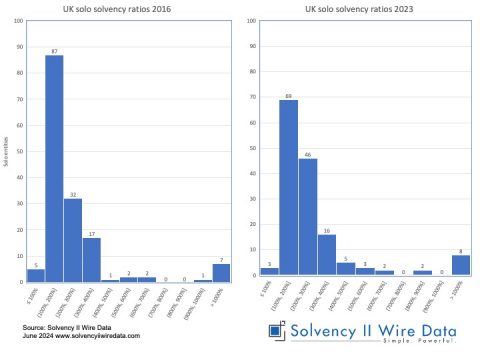
UK solvency ratio distribution 2016 - 2023

UK Solvency ratio distribution 2016 – 2023

Insurance asset allocation of Europe’s largest groups 2016 – 2023

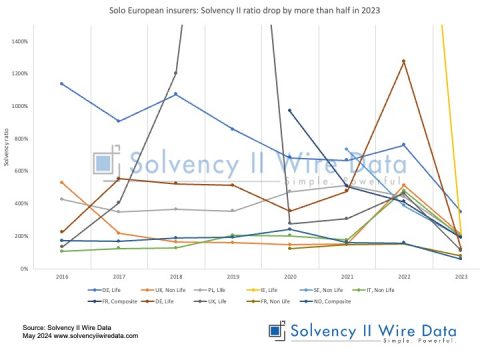
Solo European insurers Solvency II ratio drop by more than half in 2023

European insurers that halved their solvency ratio in 2023

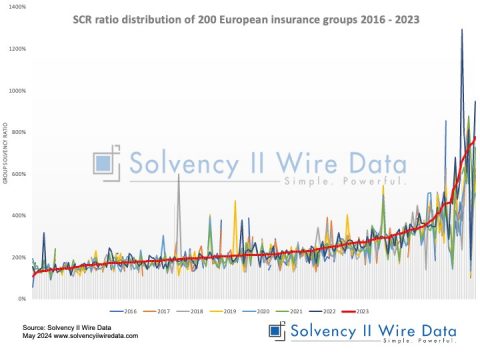
Solvency II ratio distribution of 200 European insurance groups 2016 2023

Group Solvency II ratios 2016 – 2023

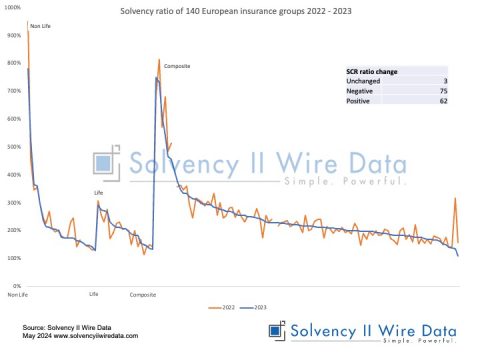
Solvency ratio of 140 European insurance groups 2022 2023

SFCR 2023: Solvency ratio analysis of nearly half of European insurance groups

Template S2505 P/IM European insurance groups 2023

SFCR 2023: Solvency II template S.25.05 partial and full internal model reporting