St James’s Place 2024 Solvency and Financial Condition Report (SFCR), published under the new Solvency UK insurance reporting rules for the first time, includes template IR.25.04, which provides a detailed breakdown of the SCR risk module components in a structured format.
The company regularly reported much of this information in previous years in the SFCR, but this year it is reported as part of the public QRTs.

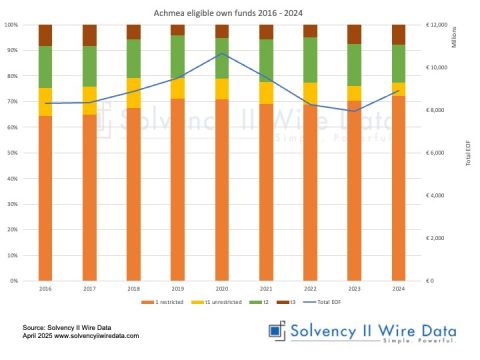
Over the past nine years the company’s market risk fluctuated between GBP 1,331 million (2023) and GBP 3,254 million (2021). In 2024 it reported market risk of GBP 1,655 million.
The largest exposures within the market risk SCR component are equity risk, followed by currency risk. Both consistently form the lion’s share of the market SCR.
New Solvency UK SCR sub-modules
The introduction of the new template will be welcomed by market participants as it will shed light on the SCR structure of the majority of standard formula firms in the UK and Gibraltar that have not until now been required to disclosed a detailed breakdown of their SCR.
It will also illuminate the SCR breakdown of UK and Gibraltar firms using a partial and full internal model, as not all have provided details in previous years.
The chart below shows the SCR component breakdown of UK groups in 2023.

The red bars represent the standard formula SCR components.
It will be interesting to see if this new level of transparincy will drive a similar move in Europe.
Data and analysis for this article were provided using the Solvency II Wire Data Comparator Tool, which maps SCR component data to the standard formula and its submodules (broadly based on the Solvency II (private) template S.26 and the Solvency UK template IR.25.04).