Category: Data Analysis
Analysis of QRT data from Solvency II Wire Data
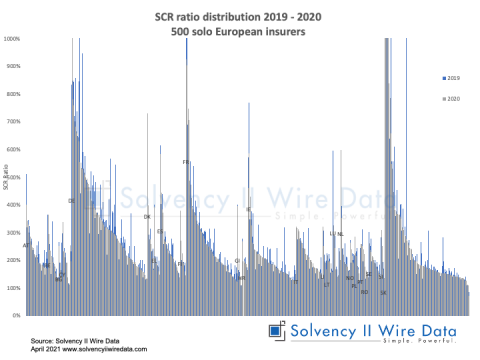
500 2020 QRTs packed with insurance data
April 19, 2021
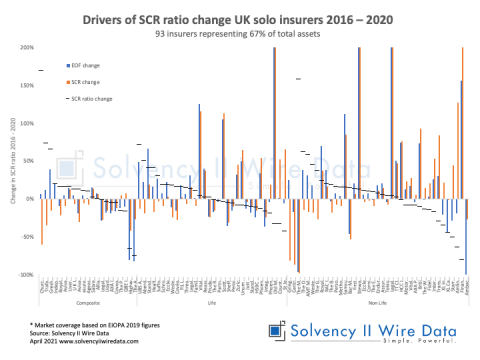
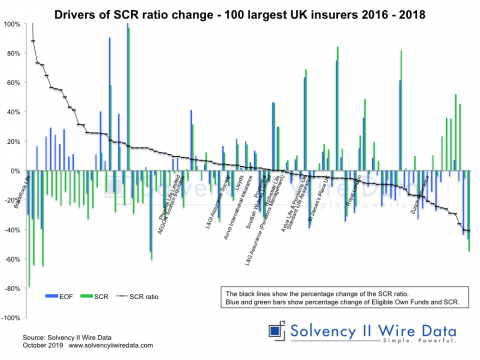
Drivers of insurance risk change in UK SCR ratios 2020
April 16, 2021
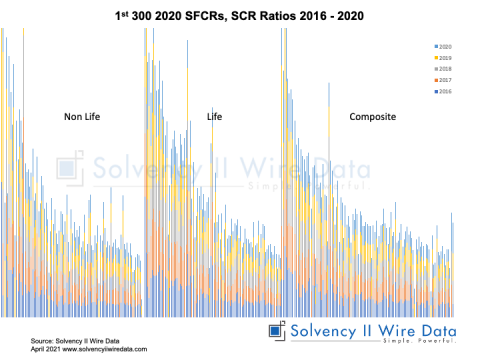
Distribution of Solvency II ratios by line of business 2020
April 13, 2021
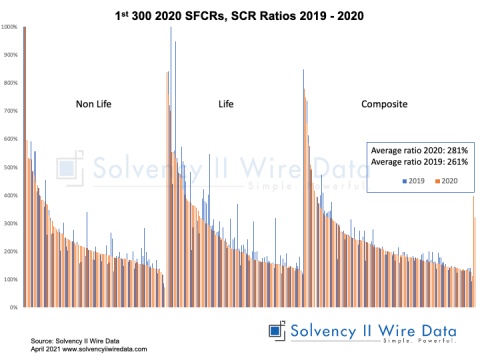
Solvency II ratios of 300 QRTs for 2020
April 13, 2021
Shifts in the Dutch Insurance Market Structure 2016 – 2019
October 29, 2020
Analysis of EEA Life Insurance Market 2018 SFCR & QRT data
January 22, 2020
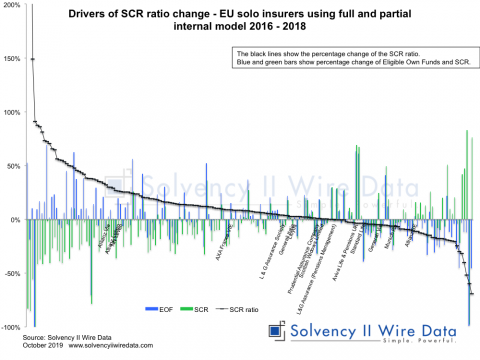
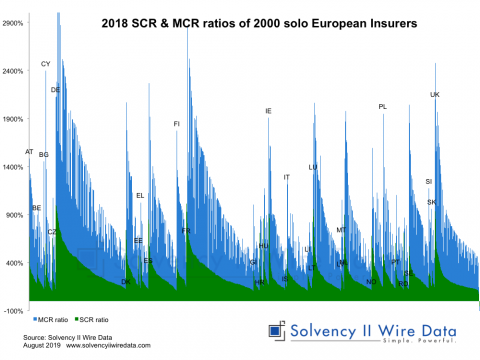
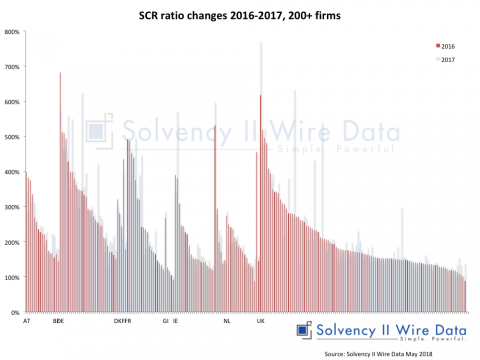
Drivers of Solvency II SCR ratio change across Europe 2016 – 2018
October 23, 2019
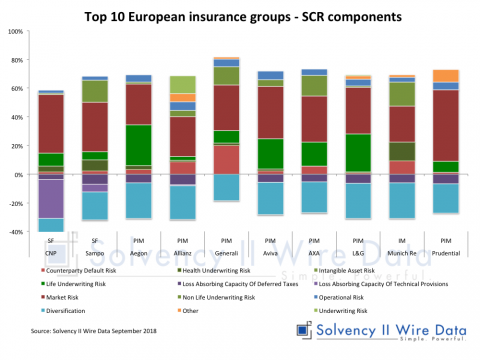
SCR components comparison of European insurance groups
September 11, 2018
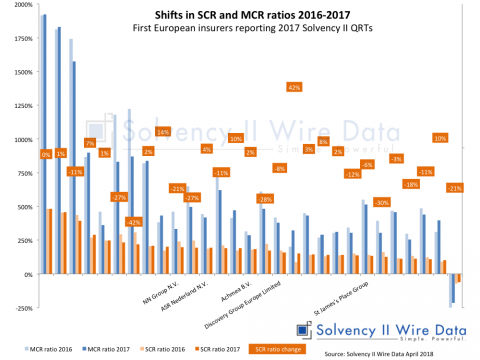
NN Group published SFCR and QRT for 2017
April 10, 2018
Top 50 European insurers with highest exposure to structured notes
February 15, 2018
Top 50 European insurers with highest exposure to property
February 13, 2018

