Coverage of the Luxembourg market has been fairly sparse so far. Of the 300 or so companies subject to Solvency II only a handful have published their SFCR to date.
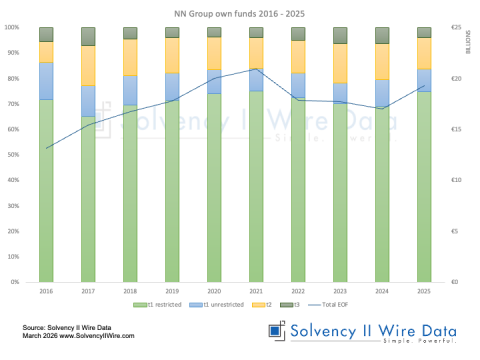
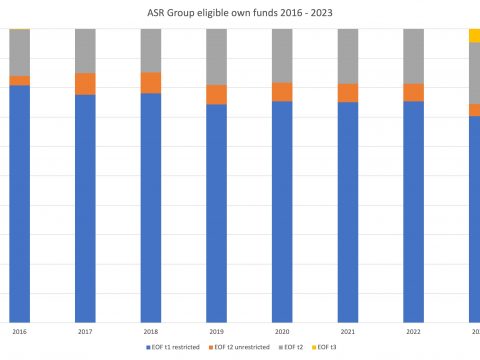
These three charts offer a ‘peek’ into the market’s Solvency II figures and quality of capital.
18 Luxembourg firms: SCR & MCR ratio
The first of the three charts below looks at the relationship between the SCR and MCR coverage ratios. It shows two instances in which the SCR is higher than the MCR (left side of the chart).
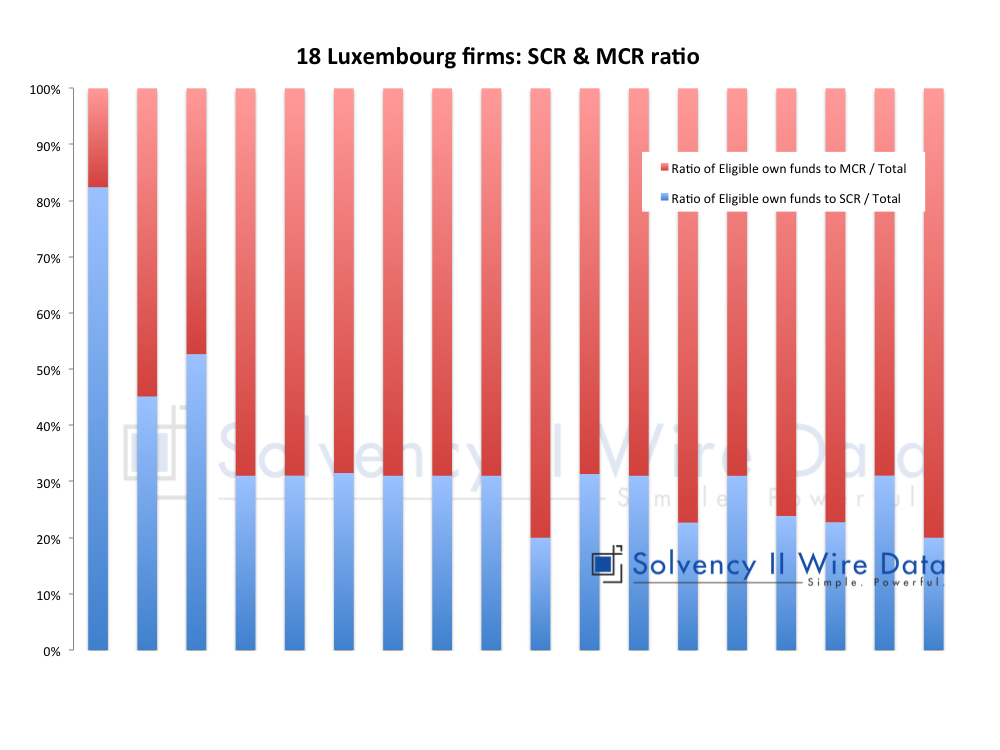
The range of ratios is much narrower than the sample of the German market (see Solvency II Wire 14/6/2017). The SCR ratio ranges from 130% to 892% and the MCR ratio ranges from 191% to 1379% … Article continues on Solvency II Wire Data (free to access, registration required)
The full data set is available on the premium Solvency II Wire Data service. A subset of the data is also available to free subscribers to the service (register here).
Working with SFCRs and QRTs on Solvency II Wire Data
Filter to SFCR Analysis from Gideon Benari on Vimeo.
SFCR Exposures Chart from Gideon Benari on Vimeo.