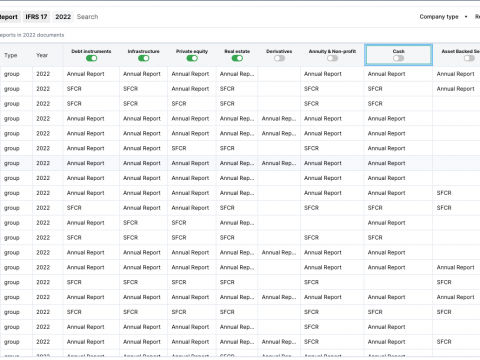
Regulatory capital requirements and figures for the Bermuda insurance market are published in the Financial Condition Report (FCR) annually. Of the c. +440 insurers subject to the regulation between 2016 to 2023, only a handful have published figures for all year; this is due to both rapid changes in the Bermudan insurance market and early adoption implementation issues (a phenomenon that was also witnessed in the implementation of Solvency II in Europe).
Analysis of the capital ratio of a selection of Bermudan insurers that have published figures between 2016 to 2023 reveals a trend in strengthening ratios since 2021. The analysis is based on figures published in the FCR of nineteen insurers, collected and processed by the Bermuda Insurance Database.
2016 – 2023 ECR ratio analysis
The Bermuda insurance capital ratio, also referred to as the ECR ratio, is calculated by dividing an insurer’s Eligible capital to meet the Enhanced Capital Requirement (ECR) by the ECR.
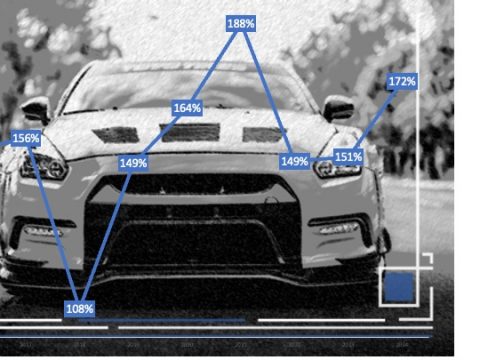
Analysis of the ECR ratios of the sample shows that 11 firms reported a lower ECR ratio in 2023 relative to the first ratio reported in 2016 (see chart below, right-hand side axis, line).
The largest drop (-90%) was reported by Somerset Reinsurance, down from 2513% in 2016 to 253% in 2023.

Across the sample, close to 80% of firms reported an increase in both ECR and eligible capital to meet the ECR (left-hand side axis, bars).
Of the firms that reported an increase in the ratio, all but one (Bermuda Life Insurance Company, which reported a drop in ECR) reported an increase in both eligible capital and the ECR.
The rise in the ratio is mostly driven by a bigger increase in eligible capital relative to the ECR; a patterned that is witnessed in the Solvency II ratios.
Similarly, a dominant driver in the decrease in the ECR ratio of the sample is a larger increase in the ECR, rather than drop in eligible capital (reported only by three firms).
2022 – 2023 ECR ratio analysis
The reported ECR ratio differences between 2022 to 2023, are significantly lower (see chart below), ranging between an increase of 31% (Bermuda Life Insurance Company, 322% to 421% respectively) and a drop of -16% (Somerset Reinsurance, 302% to 253% respectively).

12 firms reported an increase in the ratio, and a similar proportion (about 80%) reported an increase in both drivers of the ratio. Here again, the disproportionate increase of one of the elements, rather than a decrease in one, is the main driver of ratio change.
ECR ratio trend analysis
A look at the ECR ratios across the sample provides some insights into the distribution and fluctuation of the insurance capital ratios in Bermuda (see chart below).

Both the median and mean of the sample point to a downward trend in ratios from 2016 to 2021 and rise in the past three years.

While the sample is far from representative of the entire market and does include a few outliers, it nonetheless, begins to paint a picture of the solvency and capital strength of the Bermudan insurance market.
The full dataset covering available reports of over 400 Bermudan insurers can be accessed on the Bermuda Insurance Database (subscription).
Powered by Solvency II Wire Data