In early May 2018 the UK Office for National Statistics (ONS) made a presentation to the Solvency II Wire Data User Group meeting* on the first set of statistics on the financial assets and liabilities of the UK insurance sector.
The presentation followed the publication of experimental financial statistics1 on 30 April 2018, based on quarterly data collected under Solvency II as the Europe-wide insurance regulatory framework.
This pioneering work by the ONS represents one of first significant steps of using Solvency II data outside of the insurance sector. In this article, Leonidas Akritidis, Hugh Skipper and Ross Shepherd, members of the ONS team that compiled and presented the work, share their insights on the data and interactions with industry.
Introduction to ONS use of Solvency II data
The ONS, in cooperation with the Bank of England, has recently concluded that Solvency II data are suitable for UK national accounts compilation. This includes a wide range of insurance sector statistics on contribution to UK Gross Domestic Product and detailed financial statistics.
Solvency II therefore has the potential to replace some existing ONS insurance surveys, which would reduce the survey compliance burden.
It should be noted that Solvency II includes data from insurers that act mainly as pension fund managers. For national accounts purposes, these should not be classified in the UK insurance sector. Hence, the experimental statistics exclude approximately 11 such insurers/fund managers.
The experimental Solvency II-based financial statistics for the UK insurance sector are shown in table 1.
Table 1: Assets and liabilities of the UK insurance corporations sector (in £ billion)

a) technical reserve assets (also known as reinsurance recoverables)
b) net acquisition of financial assets
c) estimates may not add up due to rounding
d) Q1 is Quarter 1 January to March, Q2 is Quarter 2 April to June, Q3 is Quarter 3 July to September and Q4 is Quarter 4 October to December
This table shows non-consolidated, non-seasonally adjusted quarterly asset and liability stocks, with selected transactions. Figures 1 and 2 (below) show the proportions of UK insurers’ assets and liabilities by type as at Quarter 4, 2016.
Table 1 shows that the overall paths of total assets and liabilities increased from Quarter 1 2016 to Quarter 3 2016, followed by a fall back, after which levels were broadly stable, averaging just over £1.8 trillion.
Stocks of assets
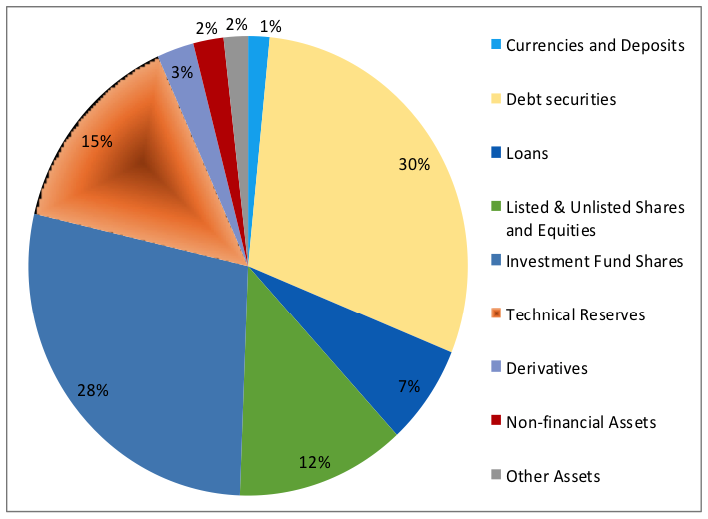
Figure 1 and table 1 illustrate that the most important types of assets in Quarter 4 2016 were:
- debt securities (30%, £0.5 trillion), of which the majority were non-government issued
- investment fund shares/units (28%, £0.5 trillion)
- technical reserve assets (reinsurance recoverables) (15%, £0.3 trillion)
- listed and unlisted shares and equity (12%, £0.2 trillion)
Figure 1: Share of assets of UK insurers in Quarter 4 2016
There were increases between Quarter 1 2016 and Quarter 3 2016 in all the above asset types.
Between Quarter 1 2016 and Quarter 4 2017 (table 1), there was a steady increase in the proportion of non-UK issued listed and unlisted share and equity assets (from 46% to 54% of total listed and unlisted share and equity) with a corresponding fall in holdings of UK issued listed and unlisted share and equity assets.
Over the same period, the proportion of non-UK issued debt security assets increased slightly (from 43% to 45% of total debt securities) with a corresponding fall in UK issued debt security.
Stocks of liabilities
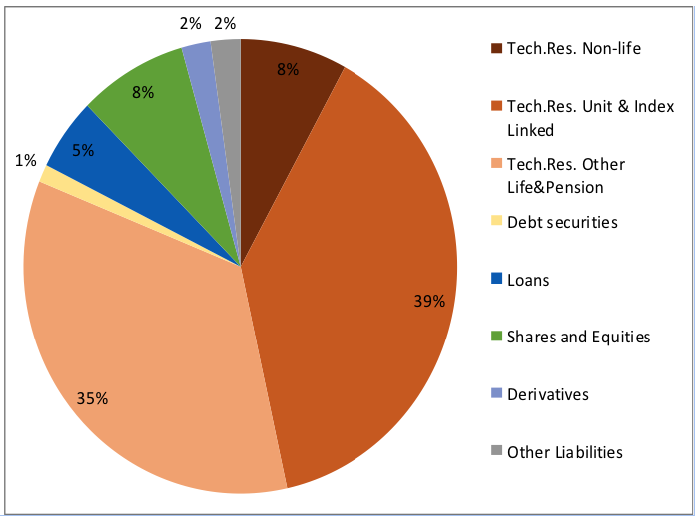
Figure 2 and table 1 illustrate that the largest component of liabilities was technical reserves, which accounted for over 80% of total liabilities in Quarter 4 2016.
Within this, the largest sub-category was the technical reserves for unit and index linked life insurance and pensions products.
Figure 2: Share of liabilities of UK insurers in Quarter 4 2016
Transactions in assets
Amongst the selected transactions in assets, there were net acquisitions between Quarter 1 2016 and Quarter 4 2017 in investment fund shares (£78 billion) and in loans (£48 billion). There were net disposals in listed shares (£15 billion) and in currency and deposits (£6 billion).
Discussion and feedback from the meeting
The Solvency II aggregates presented by ONS drew a lot of interest from the attendees of the meeting.
A large amount of detailed information about insurers’ asset holdings that was publicly available under the old PRA Returns has been lost under Solvency II. Lack of timeliness was also seen as a weakness of the publicly available data from a user perspective.
The ONS compilation of Solvency II aggregations has the potential to address these weaknesses. We have used a combination of different quarterly and annual Solvency II returns soon after submission to the PRA. This means that Solvency II-based aggregates can be compiled at a detailed level and on a relatively timely basis.
Attendees expressed an interest for the ONS to build on this initial work. In particular, they said that they would be interested in a more detailed breakdown of insurers’ asset holdings, e.g. separate identification of unit/index linked and non-linked policies. Further details that would be of interest included subdivision of investment funds and information on the risk bearers.
The ONS stated that it would be happy to be contacted by the group members, to better understand their needs, and (respecting confidentiality rules) to provide more detailed statistics and analysis.
—
1 Experimental statistics are still under development, but they are published to inform and involve users in the development process. It is worthwhile noting that the presentation of the data shows a level of detail that would meet the expectation of the Enhanced Financial Accounts (UK flow of funds). However, the level of detail will increase in the future in preparation for incorporation into the National Accounts.
*The Solvency II Wire Data User Group is an industry forum for the discussion and analysis of the Solvency II public disclosures. The forum is open to subscribers of the Solvency II Wire Data service.