Japan’s new Economic Solvency Ratio (ESR) brings the Japanese insurance market into closer alignment with modern insurance risk-based regulatory frameworks around the globe.
The new regime is not directly comparable with Japan’s well-established Solvency Margin Ratio (SMR) framework. However, a view of the whole market can help elucidate not only insurer’s relative strength but also the investment and product development opportunities afforded in the transition into the new regime.
ESR a move to market based risk assessment
The SMR sets an insurer’s capital against a risk charge built up from fixed factors, and the result was read against a 200% supervisory floor. The ESR, on the other hand, values assets and liabilities on an economic basis, sets a risk-based capital requirement calibrated to a 99.5% confidence level over one year; the ESR floor is 100%. Lapse, longevity and other insurance risks are measured directly, and market risk is measured against economic liabilities rather than book values.
A drop in number not in value
ESRs are substantially lower than the ratios reported under the SMR. The two are calculated in widely different ways. However, a comparison across the Japanese market does give some indication of the direction of travel.
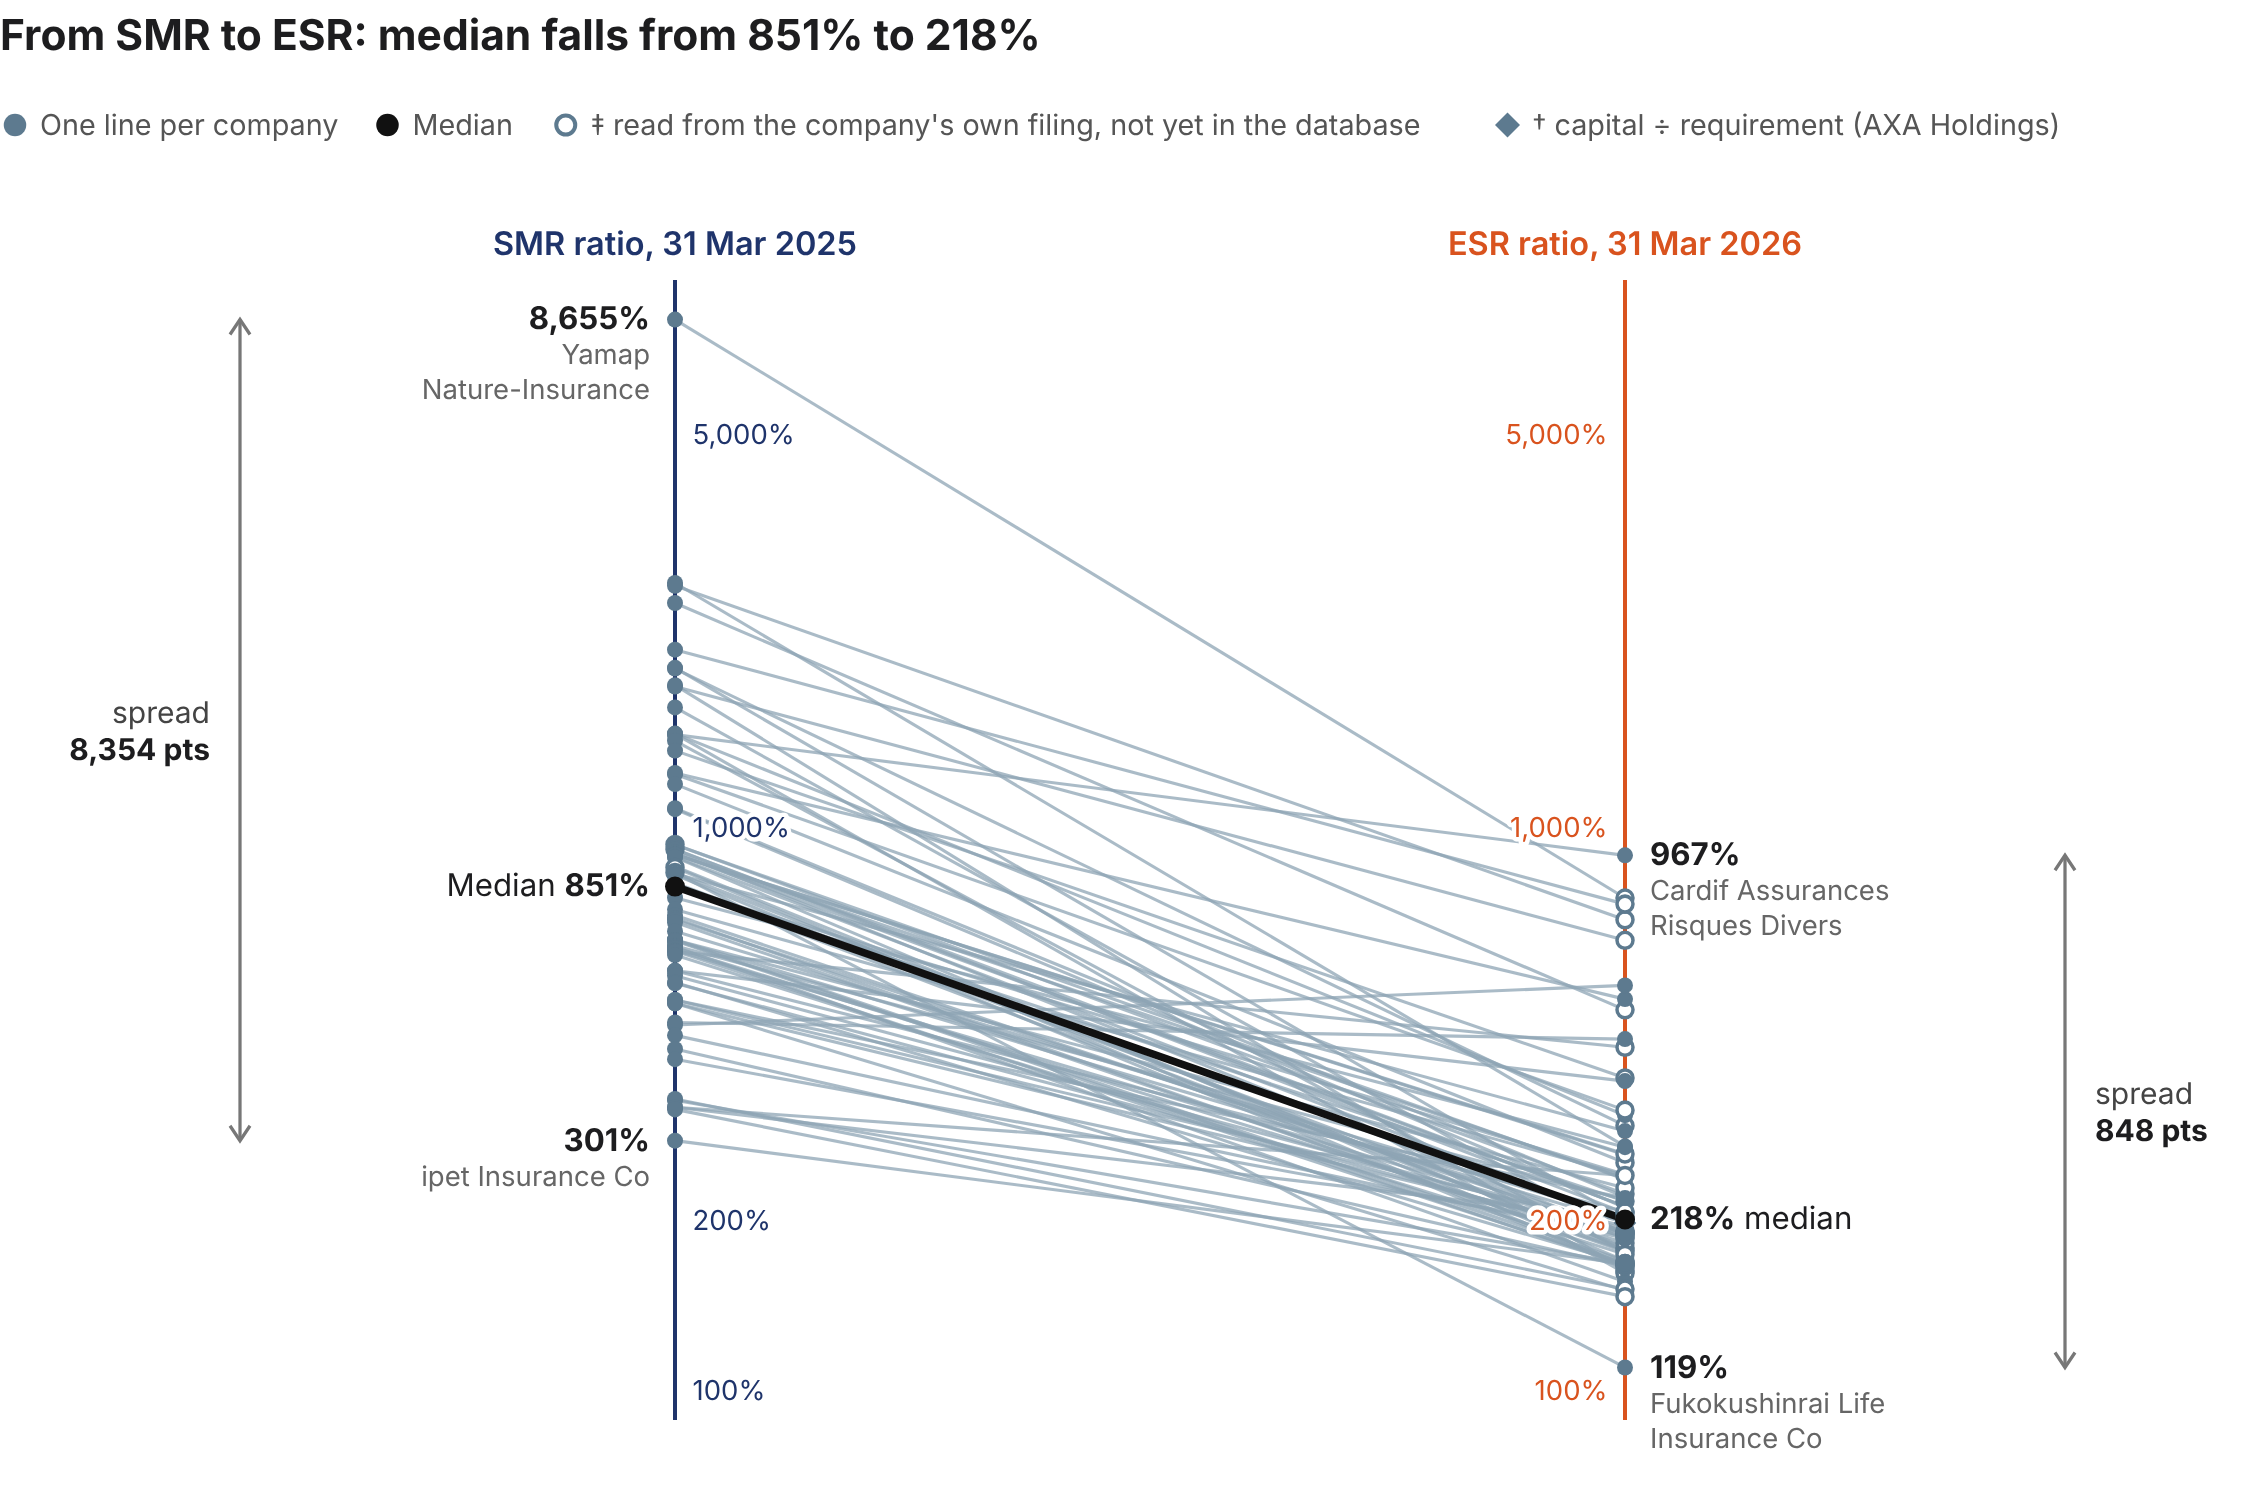
The chart below shows the shift from the last year-end SMRs, at 31 March 2025 (the end of the 2024 financial year), to the first annual ESRs, at 31 March 2026 (the end of the 2025 financial year), for over 80% of Japanese insurance groups and solo companies.
The effect on the range of published ratios is large. At 31 March 2025 the SMRs ran from 301% to 8,655%, a spread of 8,354 percentage points, while at 31 March 2026 the official ESRs run from 119% to 967%, narrowing the spread to 848 points, about one tenth of the old range.
A stronger impact on life insurers
In addition to showing the compression of ratios, the fuller market picture helps to show how each insurer’s capital position compares with its peers as the market adjusts to the new measure.
The chart below shows how each company’s position in the market moved in the transition to the new regime.
Of the companies used in the analysis, just under half (47%) moved up the table under the new ratio, just over half (51%) moved down and very few kept their place. Only one, Meiji Yasuda Trust Life, reports a higher ratio under the ESR than under the SMR (483% to 568%).
The split between life and non-life companies shows a clear distinction. Under the SMR the life companies sat higher in the table, with a median of 897% against 684% for the non-life and composite companies; under the ESR the order reverses, with medians of 208% and 239%. Over two thirds of the non-life and composite companies moved up the table (68%) and over two thirds of the life companies moved down (69%); nine of the ten largest falls in position are life insurers. This is likely to reflect the ESR’s direct measurement of lapse, longevity and interest-rate risk, which weighs most on long-dated life business.
Conclusion
Japan’s new ESR ratios are not directly comparable with the SMR regime. However, The Japan Insurance Database analysis shows that not only have ratios dropped under the ESR, but the range of ratios in the market has narrowed significantly. Furthermore, the full market analysis points to a clear downward shift of the ratios of life insurers relative to their non-life peers. These shifts and changes are likely to usher in new investment and product opportunities as insurers and related industries adjust to and understand the new regime.
The Japan Insurance Database is powered by Solvency II Wire Data.