Solvency II Wire Data today publishes the first Up & Down Chart for European and UK insurance groups, based on Solvency II reporting in the 2024 and 2025 SFCRs of 20 firms.
The chart ranks groups by the percentage change in their Solvency II SCR ratio between 2024 and 2025, providing a quick view of changes in capital strength over the period, independent of absolute capitalisation.
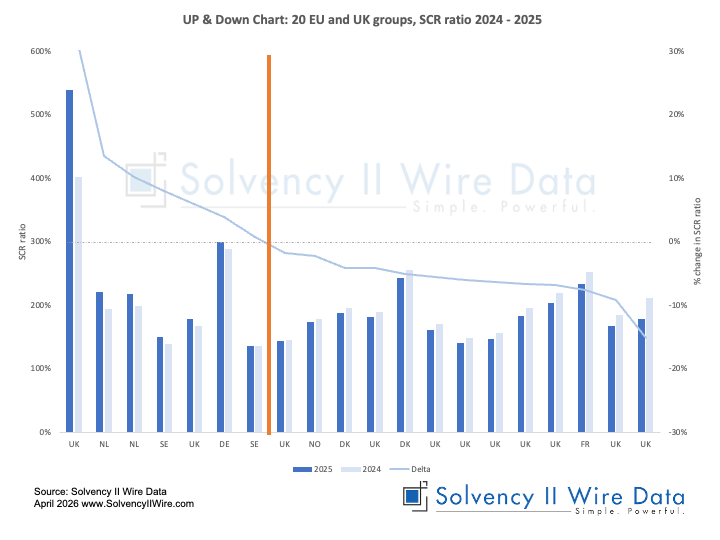
Seven groups reported an increase in their SCR ratio year-on-year (left of the orange line); two of these are UK groups.