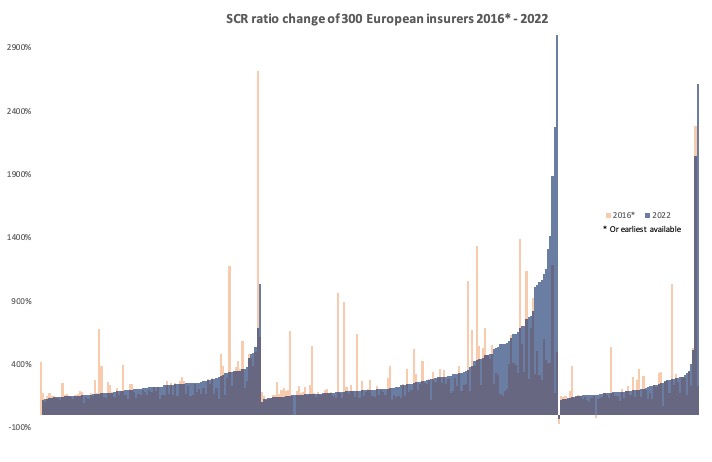
The chart shows the Solvency II SCR ratio change of 300 European insurers between 2016 and 2022.


Home » SFCR Analysis » First 2022 Solvency II SCR ratios
Archive
| M | T | W | T | F | S | S |
|---|---|---|---|---|---|---|
| 1 | 2 | 3 | 4 | 5 | 6 | 7 |
| 8 | 9 | 10 | 11 | 12 | 13 | 14 |
| 15 | 16 | 17 | 18 | 19 | 20 | 21 |
| 22 | 23 | 24 | 25 | 26 | 27 | 28 |
| 29 | 30 | 31 | ||||
analysis asset allocation Basel III bonds climate-risk Comment counter-cyclical premium Data EIOPA Equivalence European Commission European Parliament Extrapolation FSA Groups IAIS Illiquidity Premium implementation Insurance Europe Interim measures Internal model Investment Level 2 look-through LTG Matching adjustment MCR Omnibus II ORSA Pillar I Pillar II PIllar III Proportionality QRTs Regulation Reporting SCR SFCR SFCR 2023 Solvency II standard formula Stress test timeline trilogue XBRL
Copyright © 2024 Solvency II Wire
