The 6th annual Solvency II survey of non-life insurers, conducted by LCP points to Solvency II ratio convergence and improved capital management.
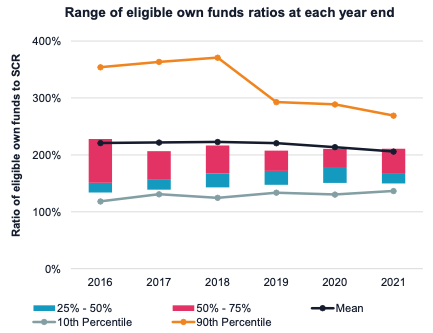
The survey, Solvency II: Growing Financial Strength, which tracks the solvency position of the 100 largest non-life insurers in the UK and Ireland since 2016 shows the average (mean) solvency ratio of the sample was 206% in 2021, compared to 214% last year (see chart below), an overall reduction from 220% in 2016.
However, the aggregate ratio of the sample has increased steadily since 2016 and is currently 175%.
According to Matthew Pearlman, Partner at LCP and co-author of the report, this bifurcation indicates that it is the very largest companies that are driving the increase in ratio.
“In fact, Lloyd’s of London, which has the largest SCR in our sample, increased its solvency ratio by 30% (from 147% to 177%). If we spread this increase across the entire sample, it is similar to the overall aggregate increase in the ratio.”
Eligible own funds driving higher solvency ratios
The findings also show that the rise in the solvency ratio is driven by a greater increase in the eligible own funds over the year than the SCR (see chart below).
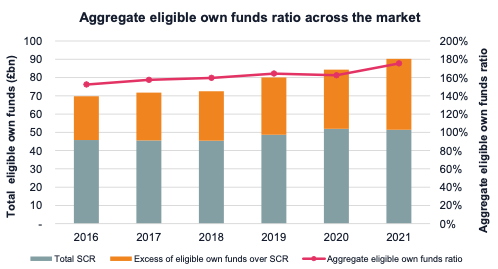
The SCR overall has reduced slightly (by less than 1%), while the eligible own funds increased by 7% so this is the driver, and as mentioned, the major part of this is Lloyd’s.
SCR ratio convergence
Interestingly, the range of the ratios between the 10th and 90th percentiles of the sample has narrowed considerably since 2016 (see above), which may be an indication of better understanding and use of the Solvency II capital rules.
“The narrowing of the range of solvency ratios suggests that firms are managing capital better and targeting the 150% – 200% range. This includes firms above this range managing downwards, and firms below this range managing upwards,” Mr Pearlman said.
While it is difficult to give a complete picture of the drivers of the convergence, there are some clues based on the details included in the SFCRs.
In a number of cases the decrease was a result of deliberate decisions by highly capitalised companies to utilise their capitalisation in different ways.
For example, Simplyhealth Access’s eligible own funds ratio reduced from 469% to 310%, which it explains was a deliberate decision to support customers and community with extra help during the pandemic.
Stonebridge’s ratio reduced from 405% to 241% over the year, driven by dividends paid to its parent company of £19m in 2021.
In other cases market impacts drove the reduction of the ratio.
WPA’s ratio, for example, reduced from 447% to 369%, driven by a large increase in the SCR caused by higher market risk due to greater exposure to equities, and higher health risk arising from its planned growth in premium income in 2022.
At the lower range of the sample, several companies managed to increase their ratio over the year in different ways.
Soteria was placed into run-off which reduced the premium risk part of its SCR resulting in an increase in eligible own funds ratio from 125% to 233%.
Ambac Assurance increased its eligible own funds ratio from 72% to just above 100%. This appears to be due simply to favourable run-off experience rather than any capital reorganisation.
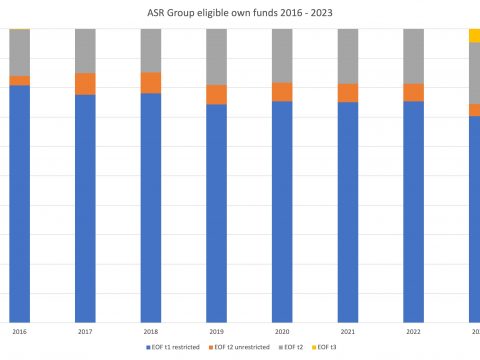
Increase use of ancillary own funds
One of the more interesting findings of the survey is the gradual increase in the use of ancillary own funds.
Ancillary own funds are a component of Tier 2 capital (Eligible Own Funds), making up around 80% of the total.
The overall total Tier 2 capital of the sample has moved very little over the year, but the proportion of firms disclosing ancillary own funds has increased (from 3% – 10% of firms).
Companies tend to have little information in their SFCRs about the capital management they are achieving through Tier 2 own funds and ancillary own funds, and some of the changes year on year are due to specific bonds maturing.
However, Mr Pearlman notes that Tier 2 capital represents over 10% of total own funds so it is clear that firms are taking advantage of the Solvency II provisions on tiering to manage their capital positions.
Conclusion
The SFCRs are not only about financial disclosures. An important part of the reports detail how firms manage risk. Key areas this year were the impact of inflation and the effect of the Russian invasion of Ukraine. Although most firms addressed these issues, there was often little mention of how these risks actually affect their business.
We encourage firms to be more open in their discussion of these risks, and others for example climate change, which will then allow readers to understand better how they manage these risks.
Solvency II: Growing Financial Strength is LCP’s sixth annual analysis of Solvency II reporting from the top 100 non-life insurers across the UK and Ireland.