COMMENT


Prevailing conventional wisdom dictates that insurers do not pose systemic risk. This is argued both on the basis of their business model and on the emphatic cry that “insurers are not like banks”.
In this article* Christos Ellinas, Neil Allan and Neil Cantle challenge this convention. Analysing data on 90 UK life-insurers they show the inherent systemic risk in the structure of the insurance industry and call into question our existing risk management practices.
Traditional analysis of the systemic importance of insurance firms has focused on firm-based information that relies on the financial condition of individual firms.By looking at factors such as admissible assets and excess capital the strength of each individual firm is determined.
This is then aggregated across firms to draw assumptions and conclusions about the systemic resilience of the industry and the level of systemic risk it poses. However, we argue that such a methodology can be misleading and does not accurately capture the probability of default once a number of firms fail, because of a failure to understand the interconnectedness of insurance firms.
Evidence of a hidden heavy tail
Looking at empirical evidence of loss events, as recorded within the industry, would, on first review, suggest that firm-based analysis is correct.
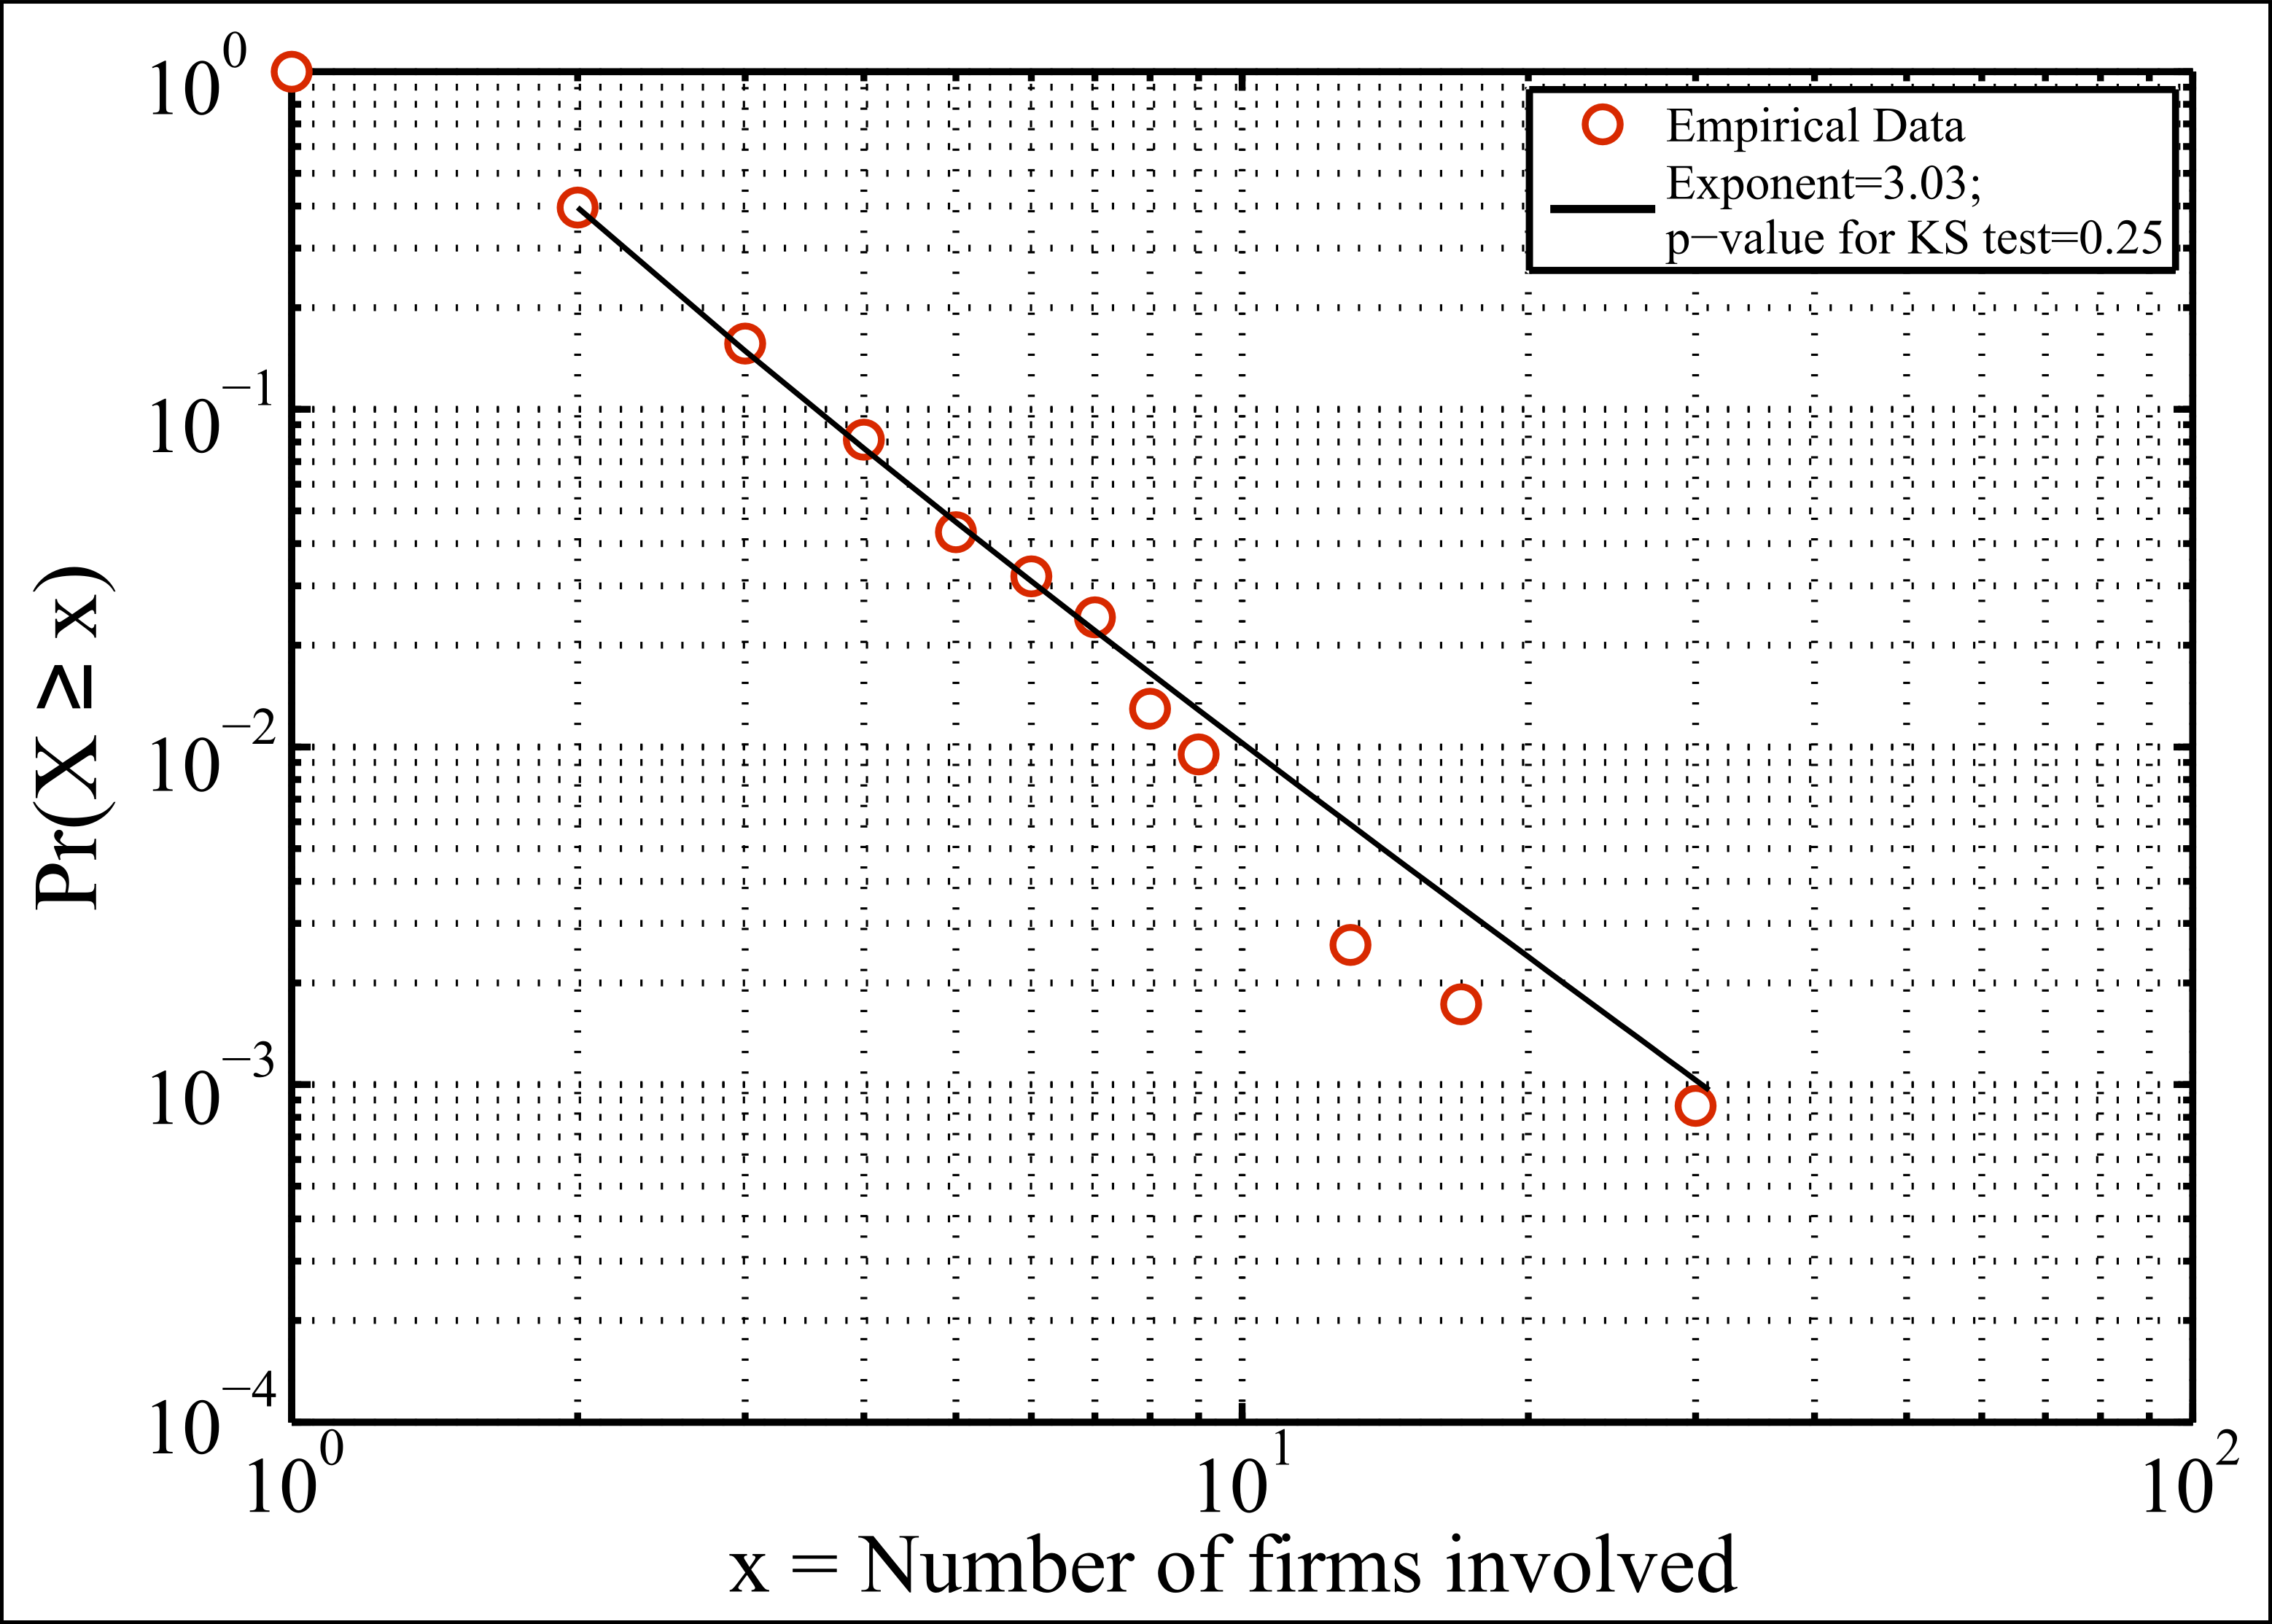
We used a cumulative probability distribution plot of the number of insurance firms involved in a single loss event, as recorded in the ORIC database over six years. The result (Figure 1) shows that the average number of firms involved in each failure event, or cascade, is merely 1.78. But a divergence of up to 18 standard deviations (corresponding to 30 firms) is noted, implying clear evidence of a heavy tail.
In fact, the noted straight line on the log plot suggests a ‘power law’ distribution[1], a signature feature of a wide range of complex systems[2].
The wide divergence makes a strong case for the need to account for the emergence of systemic risk, as surprisingly large failure cascades do happen.
To understand why this is the case we need to look at how insurance firms are connected and the cascading effect (also known as the ‘domino effect’). In other words, we want to understand how each failure in the chain increases the probability of the failure of the remaining firms.
Networks and unravelling cascades
Systemic risk can be defined as the result of a cascading process that unravels throughout a network structure. The empirical evidence of reported losses noted above suggests that today’s insurance firms are becoming increasingly interconnected and that they appear to be embedded in the same network. As a result, systemic risk poses a real threat, as the failure of a single firm can affect all the other firms connected to it and thus have a disproportionate effect on the market as a whole.
To establish the interconnectedness of the system we examine the indirect connections between insurers, rather than direct connections (such as cross ownership or belonging to the same corporate group).
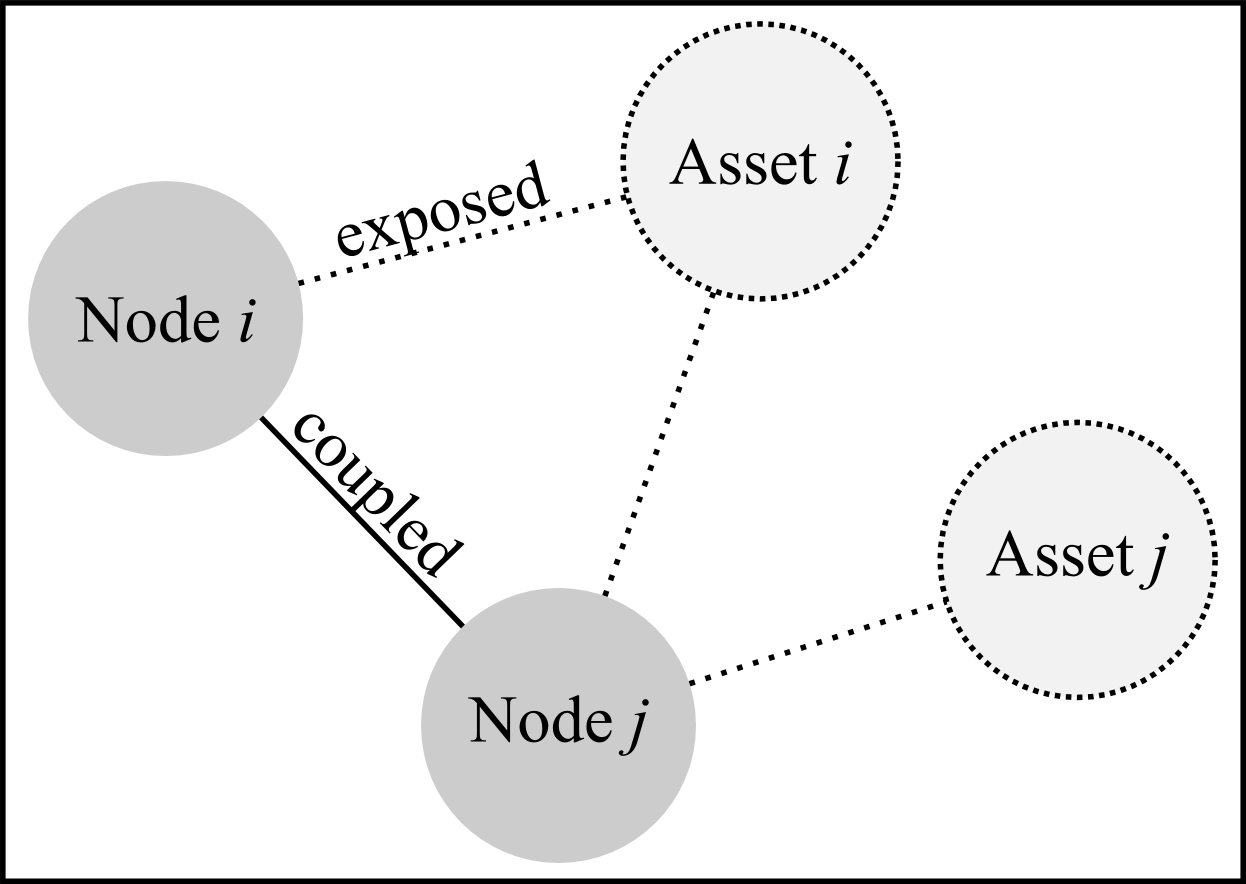
Specifically, we assume that firms with comparable admissible assets invest in assets with similar characteristics (e.g. volatility, risk etc.). It is therefore reasonable to assume that larger firms have the capacity to invest in higher-risk, higher-return assets and hence, are more likely to be linked. The interconnectedness, or “network”, that insurers form is inferred through their exposure to similar assets (Figure 2). Insurers could also be related by virtue of having common reinsurance counterparties or major suppliers, for example.
As such, the resulting network is expected to have an assortative mix, where highly connected nodes (the individual insurance firms) are more likely to be connected to each other[3] and be of heterogeneous nature, in terms of individual node degree.
Hence, we argue that even simple assumptions such as the one noted above bring these methodologies closer to reality and thus, increases their practical utility.
A Criticality Index and Sensitivity Index
To test this assumption we used a sample of 90 UK life insurers and introduced a simple analytical model that can simulate a ‘cascade failure’ process using numerical simulations. Such analysis can lead to a better understanding of an individual firm’s vulnerability to systemic risk, its role in the systemic failure process, and suggest appropriate actions to mitigate the risk.
The impact of interconnectivity on this system was assessed by artificially failing each node and capturing the maximum number of nodes that were subsequently affected (i.e. cascade size). Such failure cascades can be seen as the result of a domino effect as it ripples across the network.
Based on this raw set of results, we constructed two indices in order to provide the means of capturing the systemic role of each firm: a Criticality Index and a Sensitivity Index.
The Criticality Index captures the capacity of a firm to impact the entire system by triggering large failure cascades (a sort of too-big-to-fail firm). It provides a measure of how important a firm is, based on its capacity to cause other firms to fail throughout the entire system.
The Sensitivity Index, on the other hand, captures the probability of a firm being impacted by such cascade.
Demonstrating insurance interconnectivity
The cascade process was simulated across an ensemble of 1,000 networks i.e. the network of insurers was tested under 1,000 distinct topologies to limit the influence of possible random effects.
Interestingly, a relatively large proportion of firms induce no cascades (so called “non-critical” firms) due to their failure, although this portion is substantially reduced as the impact of interconnectivity increases.
At the point where the influence of interconnectivity is minimum (i.e. the operation of one insurer is not likely to be affected by other insurers) a total of 35 firms have no capacity in triggering any failure cascades; this number drops to 10 as the impact of interconnectivity reaches its maximum.
Hence, the capacity of a firm to impact the entire system is conditional not only upon the underlying network structure and its own individual attributes, but also upon the degree to which its function may be affected by the operation of its neighbouring firms.
Our simulation showed that non-critical firms (those incapable of triggering failure cascades) may become critical if the nature of the interaction between other firms becomes stronger.
In fact, it appears that the impact of interconnectivity has an abrupt effect on the number of nodes capable of inducing cascades of a given size. In the case of small failure cascades, a continuous and incremental increase in the number of nodes is noted, until a saturation point is reached. Interestingly, and in the case of larger failure cascade sizes, a ‘bursty’ behaviour is noted, where increasing the impact of interconnectivity has no effect until a certain point is reached. Beyond this point, the number of firms that can induce large failure cascades increases significantly, suggesting that the number of critical firms abruptly changes as the coupling between firms increases.
Challenging the risk management process
Evidence of a power law distribution of cascade sizes is of great importance, as it draws parallels with self-organising criticality – a theory that describes critical phenomena that underpin various systems, ranging from earthquakes to financial crises[4].
The size of a possible failure cascade is only limited by the size of the system rather than its reduced probability of occurrence – the latter would have been the case if the cascade distribution exhibited a normal distribution (null model).
This observation has three main consequences: a) both small and large failure cascades follow the same dynamics; b) large failure cascades may occur without any large exogenous force; and, c) the expected impact of a local failure cannot be estimated a priori.
One would naturally expect that large failure cascades are the inevitable conclusion of an unfortunate set of conditions aligning. Though this may indeed be the case, it is of no surprise that such extraordinary conditions would greatly impact the system.
Perhaps more surprising is the emergence of such failures that do not require these conditions, as they may arise as a result of the exact same cause as local failures i.e. the failure of a single node.
Assuming that resource spent in risk mitigation is proportional to the envisioned impact of the risk materialising, the combination of the three points mentioned above challenges the very notion of the risk management process. Specifically, as one may not reasonably assess whether a local failure is bound to trigger a cascade or not, assigning a suitable amount of resource for mitigating against its impact is bound to be a challenging task.
Towards managing the systemic risk of insurers

Though the aim of this work is to introduce a novel way for assessing systemic risk in the insurance industry, along with raising a number of questions about the means of mitigation actions and regulatory frameworks, numerous challenges still remain.
For one, both individual firms and regulators are left with the considerable task of capturing meaningful interactions between firms. By doing so, one may begin to explore the impact of various network structural features on the robustness of the system.
Although some work around these areas already exists[5], it is still immature – theoretical ideas need to be generalised and developed further before their output can be put into practical use. Increasing data quality, by directly observing the network of relationships, is expected to increase the practical relevance of similar approaches[6]. Finally, the insurance community faces the challenge of keeping up with the ever increasing developments in the field of complex networks.
In an era of increased interconnectivity, non-linearity becomes the rule rather than the exception, fostering local events with a global impact. Academia has risen to the challenge by developing novel frameworks that can account for these effects, complex networks being one of the most successful. It is now up to the industry to harvest this insight and engineer the conditions for a more robust financial system.
—
*The article is based on the paper “How Resilient is Your Organisation? From Local Failures to Systemic Risk”, winner of the 2015 Best Overall Paper, ERM Research Excellence Award in Memory of Hubert Mueller, presented at the ERM Symposium 2015, Washington D.C., USA, 2015
The views expressed are the Authors’ own.
Neil Allan is Managing Director at Systemic Consult Ltd
Neil Cantle is Principal and Consulting Actuary at Milliman
Christos Ellinas is a Doctoral Research Engineer at the IDC in Systems, University of Bristol, UK and Systemic Consult Ltd., UK.
[1] A. Vespignani, “Predicting the behavior of techno-social systems,” Science, vol. 325, p. 425, 2009.
[2] A. Vespignani, “Predicting the behavior of techno-social systems,” Science, vol. 325, p. 425, 2009.
D. Helbing, “Globally networked risks and how to respond,” Nature, vol. 497, pp. 51-59, 2013. S. H. Strogatz, “Exploring complex networks,” Nature, vol. 410, pp. 268-276, 2001.
[3] M. E. Newman, “Mixing patterns in networks,” Physical Review E, vol. 67, p. 026126, 2003.
[4] P. Bak and M. Paczuski, “Complexity, contingency, and criticality,” Proceedings of the National Academy of Sciences, vol. 92, pp. 6689-6696, 1995
[5] P. Gai and S. Kapadia, “Contagion in financial networks,” in Proceedings of the Royal Society of London A: Mathematical, Physical and Engineering Sciences, 2010, p. rspa20090410. E. Nier, J. Yang, T. Yorulmazer, and A. Alentorn, “Network models and financial stability,” Journal of Economic Dynamics and Control, vol. 31, pp. 2033-2060, 2007
[6] R. Cont and A. Moussa, “Network structure and systemic risk in banking systems,” Edson Bastos e, Network Structure and Systemic Risk in Banking Systems (December 1, 2010), 2010. S. Battiston, M. Puliga, R. Kaushik, P. Tasca, and G. Caldarelli, “Debtrank: Too central to fail? Financial networks, the fed and systemic risk,” Scientific reports, vol. 2, 2012. R. Cont, A. Moussa, and E. B. Santos, “The Brazilian interbank network structure and systemic risk,” 2010.
—
To subscribe to the Solvency II Wire mailing list for free click here.